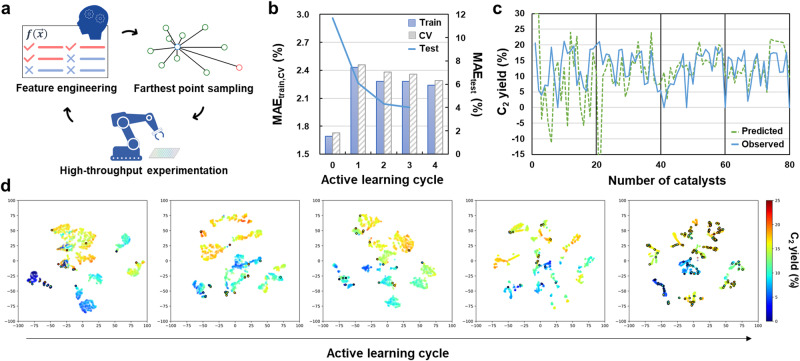
Fig. 2. Active learning implemented for the OCM catalyst design.
a Schematic of the active learning loop. The feature engineering was repeated five times with the data of 20 catalysts added per update. The model scores and the testing results are shown in (b) and (c), respectively. The deviation between predicted and observed C2 yields decreased monotonically throughout the active learning cycle. (d) Eight features were selected from 5568 first-order features to minimize the MAE in LOOCV with Huber regression. The development of the feature engineering and prediction is visualized based on t-distributed stochastic neighbor embedding (t-SNE). The circled data points are the test results except for the last cycle, which used the training data instead. The color reflects the predicted or observed C2 yield. Each t-SNE image delineates how the machine perceives the composition and performance of individual catalysts in each active learning cycle. The increase in the number of clusters during active learning signifies the evolution of the machine’s ability to discern diverse catalysts based on their distinct composition-performance relationships.

