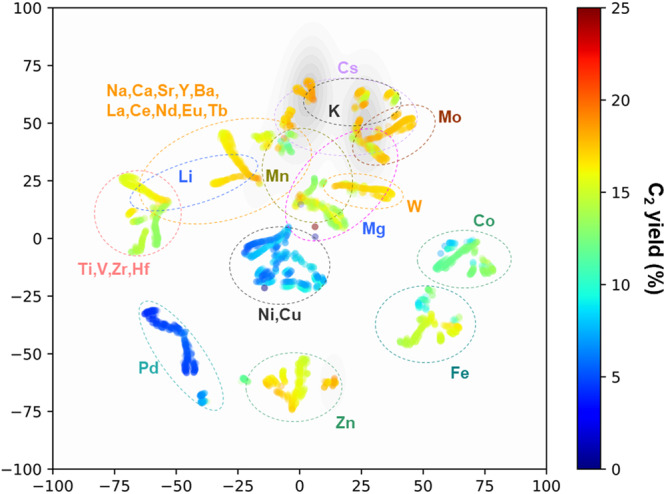
Fig. 3. Machine perception of the OCM catalyst design.

The feature space of the latest model is visualized by t-SNE, along with the Gaussian kernel density estimation for the C2 yield above 18%. The dotted lines indicate the regions where catalysts containing individual elements are concentrated. This visualization illustrates the machine’s perception in identifying the composition and performance of catalysts based on specific elements. It showcases common elements found in high and low-performing catalysts, similarities among elements within the feature space, and other pertinent insights.
