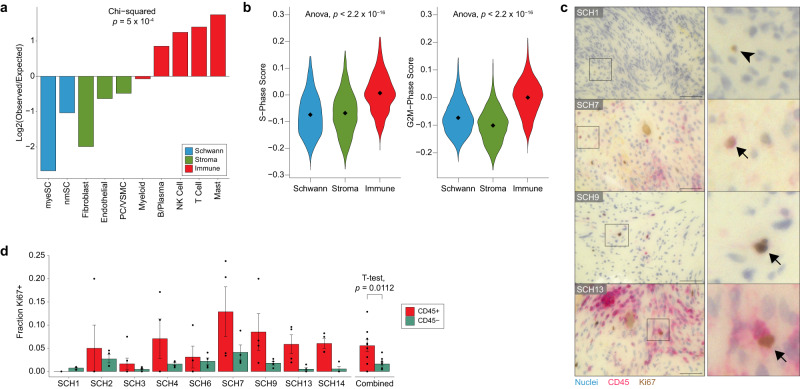
Fig. 3. Immune cells are disproportionately cycling in the VS TME.
a Cycling cells (Fig. 1c) were scored based on gene signatures of all other cell types in the VS TME (e.g., nmSC, T cells, etc.) and assigned to the cell type for which they scored highest. Frequencies of each cell type observed in this cluster were compared to expected rates. b Violin plots of G2M and S-phase scores for Schwann, stromal, and immune cells. c Double-stain IHC of representative high-power field (HPF) from VS tumor FFPE samples. Cycling cells are labeled Ki67 and immune cells are labeled with CD45. Arrowhead indicates a representative CD45-Ki67+ cell. Arrows indicate representative CD45 + Ki67+ cells (scale bar = 50 μm). d Barplot showing the fraction of CD45+ (red) and CD45- (green) cells that are Ki67+ within available samples (left) and averaged across all samples (right). Error bars on left show standard error for quantification of each group across 3–6 HPF. Error bars on the right represent standard error of mean measurements across samples (n = 9 samples). Two-sided t-test was used for comparison. Source data are provided as a Source Data file.

