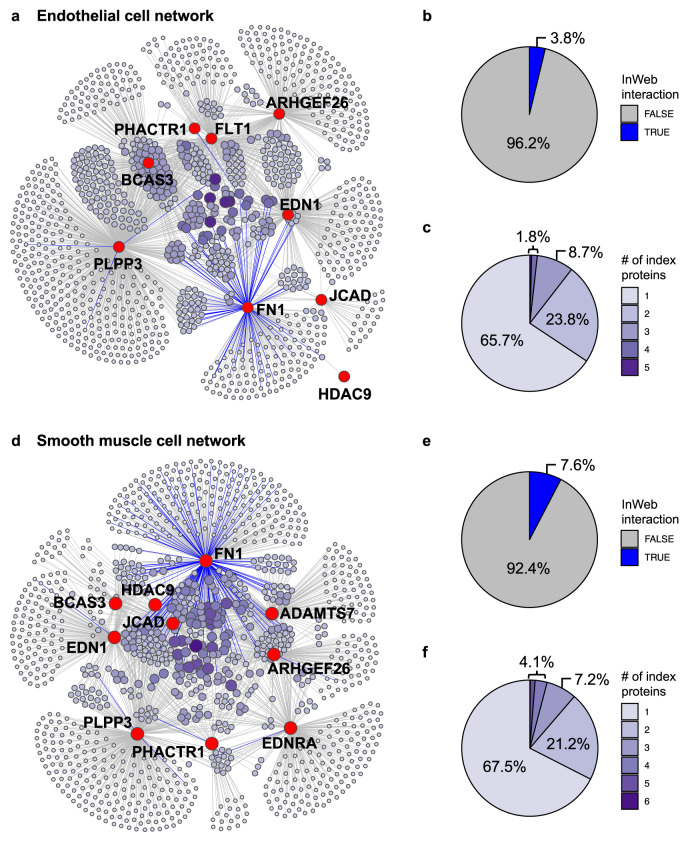
Fig. 2. Combined PPI network in endothelial or smooth muscle cells.
a The combined PPI network of 9 index proteins derived from IP-MS experiments in endothelial cells. Index proteins and their interactors are shown as red and purple nodes, respectively, and the edges between them indicate significant interactions in the IPs. The size and color of the interactor nodes indicate interactor frequency (i.e., the number of index proteins linked to each interactor), with larger and darker nodes representing more recurrent interactors. Color of the edges indicates whether each interaction is a known interaction in InWeb (blue) or a potentially novel interaction not found in InWeb (gray). b Distribution of InWeb vs. non-InWeb interactions in the network in (a). c Distribution of interactor frequency in the network in (a). d–f Characteristics of the combined PPI network of 10 index proteins derived from IP-MS experiments in smooth muscle cells. The same legends for (a–c) apply here.

