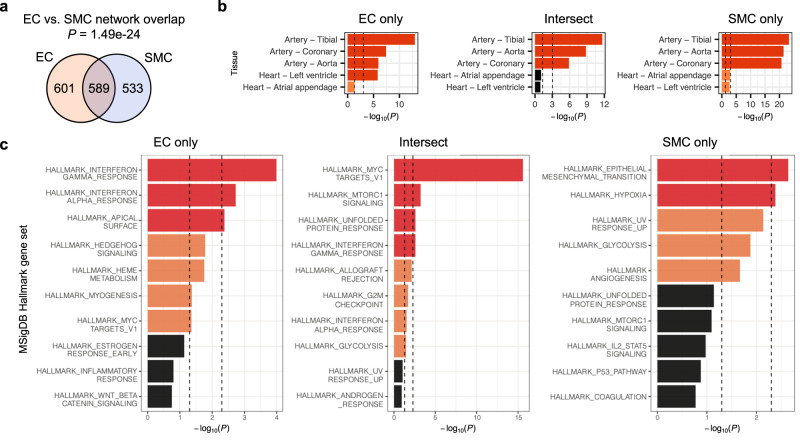
Fig. 3. Comparison of PPIs in the endothelial cell (EC) vs. smooth muscle cell (SMC) networks.
a Overlap between interactors in the EC and SMC PPI networks. b Cardiovascular tissue enrichment calculated using GTEx tissue-specific genes based on RNA-seq data. Interactors found exclusively in the EC (EC only) or SMC (SMC only) network and interactors found in both networks (Intersect) were analyzed separately and compared against the rest of the genome. c Gene set enrichment calculated using MSigDB Hallmark gene sets. EC only, SMC only, and Intersect interactors were compared against the non-interactors detected by IP-MS; only the top ten gene sets are shown for each analysis. All P values were calculated using one-tailed hypergeometric tests. For (b, c), nominally (P<0.05) or Bonferroni-significant (P <0.05/number of tissues or gene sets) results are shown in orange or red, respectively; gene counts used for analysis are shown in Supplementary Data 10 and 11.

