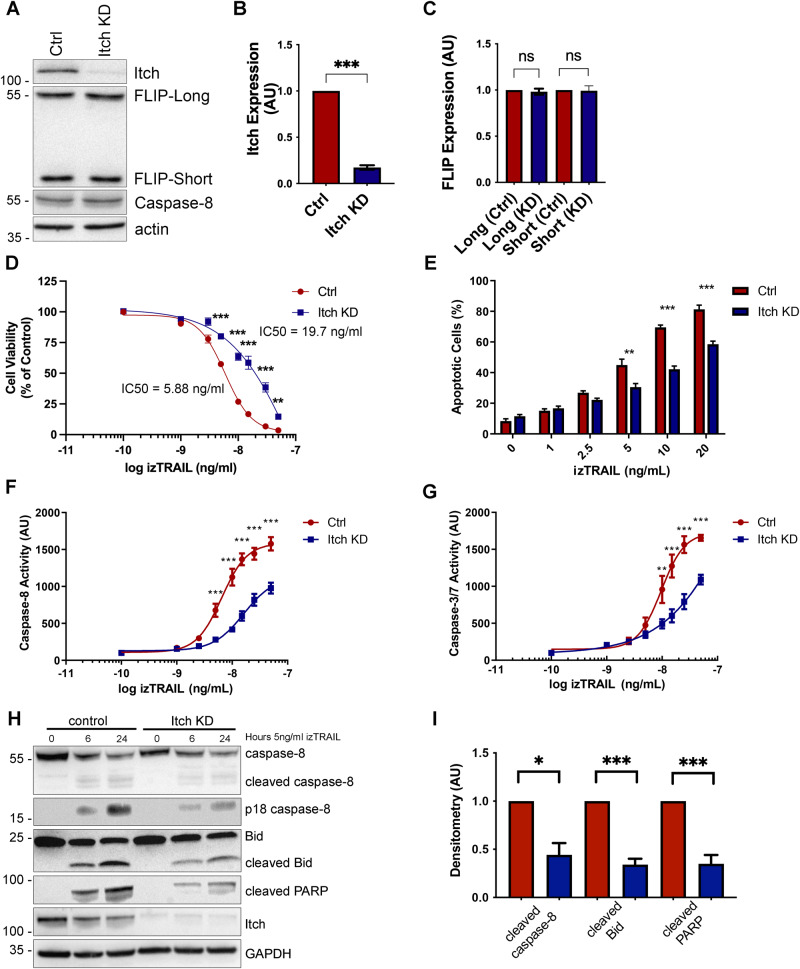
Fig. 1. Itch knockdown increases resistance to TRAIL-mediated apoptosis in OE33 cells and impairs caspase-8 cleavage and activity.
A Western blot analysis of basal expression of FLIP(L), FLIP(S), FADD, Procaspase-8, TRAIL-R1, TRAIL-R2 in OE33 Ctrl (shCTRL) and Itch knockdown (KD) cells stably expressing shRNA targeting ITCH. B Bar graph showing the densitometry of Western blot analysis of Itch expression normalised to the actin loading control in five independent experiments. C Bar graph showing the quantification for FLIP-Long and -Short expression in control shRNA and Itch knockdown (KD) cell lines. N = 5 independent experiments. D OE33 Ctrl and Itch KD cell lines were subjected to treatment with increasing doses of izTRAIL for 24 h (0–50 ng/mL). Cell viability was measured using the CellTiterGlo Assay. Data was normalised to an untreated control. E OE33 Ctrl and Itch KD cells were treated with 0–20 ng/mL TRAIL for 24 h and then stained with FITC-conjugated Annexin V and propidium iodide to assess the number of apoptotic cells under each treatment condition. Bar graph showing the percentage of apoptotic cells (Annexin V-positive cells) of the population. F Caspase -8 and (G) Caspase -3/-7 activity in OE33 Ctrl and Itch KD cell lines was measured following treatment with increasing concentrations of izTRAIL (0–50 ng/mL). Activity was measured 6 h post treatment using the Caspase -3/-7 or the Caspase -8 Glo assays. H Western blot analysis of cleaved Caspase-8, Bid and PARP in OE33 Ctrl and Itch KD cell lines following treatment for 6 or 24 h with 5 ng/ml izTRAIL. I Densitometry of the experiment in (C) in four independent repeats. Error bars represent the standard error of the mean. Statistical significance was measured by Student’s t test. *p < 0.05, **p < 0.01, ***p < 0.001.

