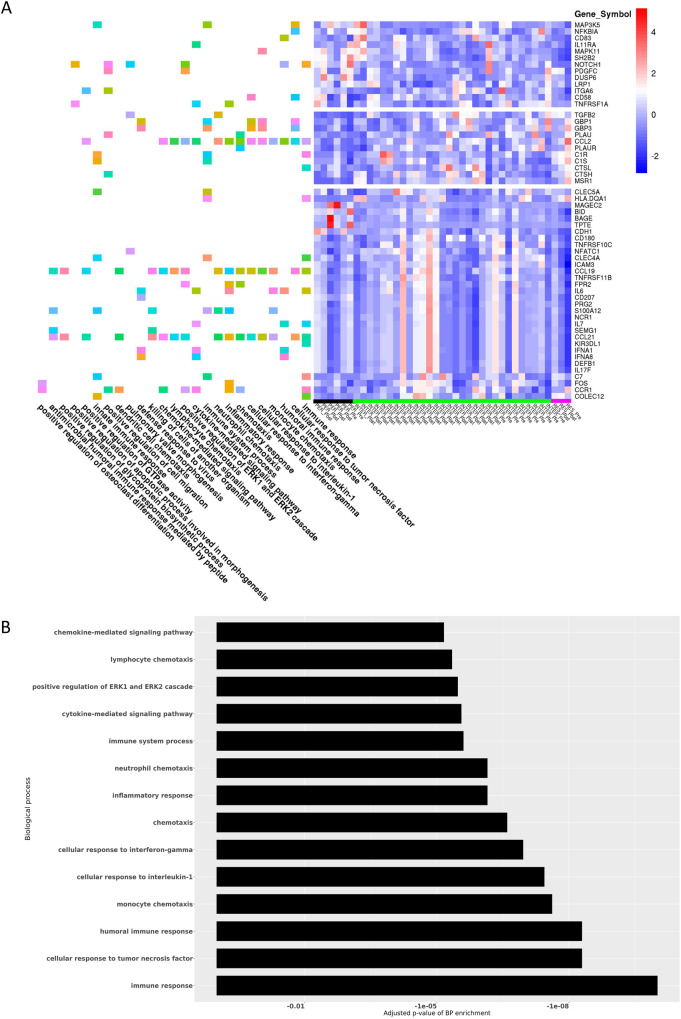
Fig. 5. Differential gene expression in posttreatment samples of viral replication resistant versus permissive tumors (N = 13 patients).
A RNA was isolated from tumor biopsies before and after MV therapy, expression was analyzed by Nanostring and differentially expressed genes were used to determine differentially activated pathways. The heatmap shows gene expression intensity across samples (right panel) and biological processes enriched by each gene (left panel). Permissive tumors (N = 3 patients) are underlined with a black bar, intermediate permissiveness (N = 9 patients) with a green bar and resistant tumors (N = 1 patient) with a magenta bar at the bottom of the heat map. Expression of the genes presented in this plot was at least twofold different (up- or downregulated) with P value 0.05 or lower in the group of good responders vs poor responders after the treatment. B Bar plot depiction of adjusted P values corresponding to biological processes (BP) of the Gene Ontology (http://geneontology.org/): The 14 processes that are most differentially enriched post treatment in patients with replication permissive versus resistant tumors are shown here.

