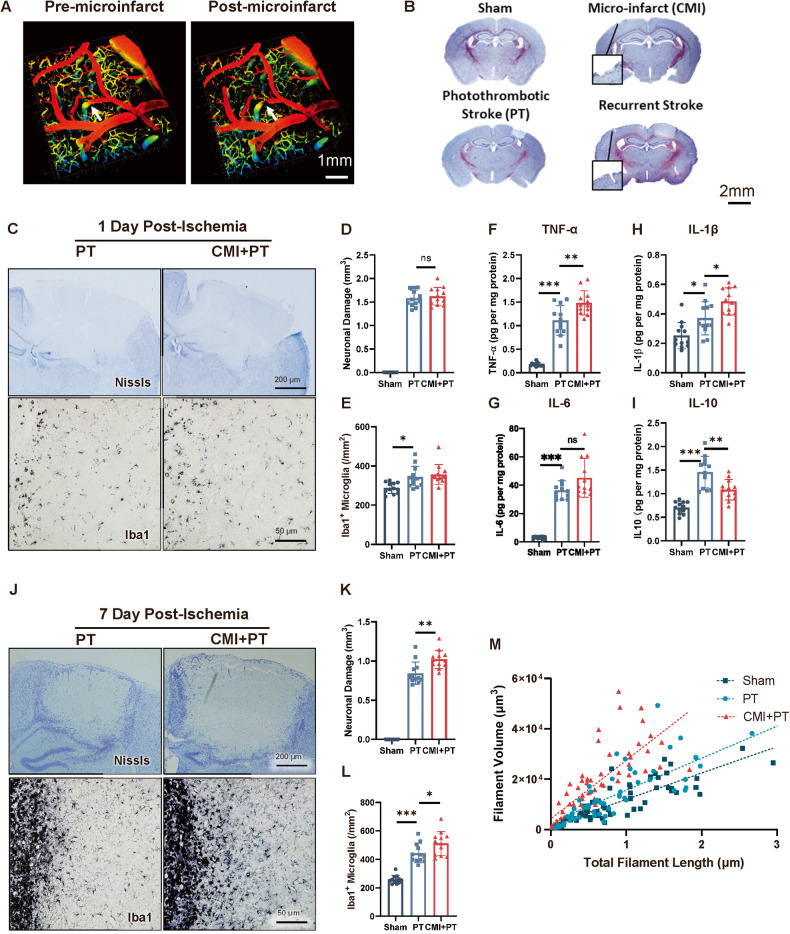
Fig. 1. CMI initiates trained immunity and exacerbates secondary stroke in contralateral cortex.
A Representative three-dimensional two-photon images showing CMI induction. Scale bar, 1 mm. B Representative Nissl staining showing the ischemic location and pathologies of CMI and PT. Scale bar, 2 mm. C–E Representative Nissl and Iba1 IHC staining and quantitative analysis of infarct size and microglial activation after one-day post-PT stroke. Scale bar, 200 μm for Nissl staining and 50 μm for Iba1 staining, n = 12 mice per group. One-way ANOVA F2, 33 = 468.2, p < 0.0001. PT vs. CMI+PT: p = 0.7213. (D) and F2, 33 = 7.497, p = 0.0021. PT vs. CMI+PT: p = 0.7471 (E) with Turkey’s correction. F-I Quantitative ELISA analysis of TNF-α (F), IL-6 (G), IL-1β (H), and IL-10 (I) expression in contralateral cortex 6 h after CMI. One-way ANOVA F2, 33 = 97.44, p < 0.0001. PT vs CMI+PT: p = 0.0013 (F); F2, 33 = 76.13, p < 0.0001. PT vs CMI+PT: p = 0.0511 (G); F2, 33 = 16.58, p < 0.0001. PT vs. CMI+PT: p = 0.0214 (H); F2, 33 = 28.71, p < 0.0001. PT vs. CMI+PT: p = 0.0020 (I). J–M Representative Nissl and Iba1 IHC staining and quantitative analysis of infarct size and microglial activation after seven-day post-PT stroke. Scale bar, 200 μm for Nissl staining and 50 μm for Iba1 staining, n = 12 mice per group. One-way ANOVA F2, 33 = 314.8, p < 0.0001. PT vs. CMI+PT: p = 0.0009 (K) and F2, 33 = 50.87, p < 0.0001. PT vs. CMI+PT: p = 0.0331 (L). Data are presented as mean ± standard deviation (SD), n.s., non-significant, *p < 0.05, **p < 0.01, and ***p < 0.001.

