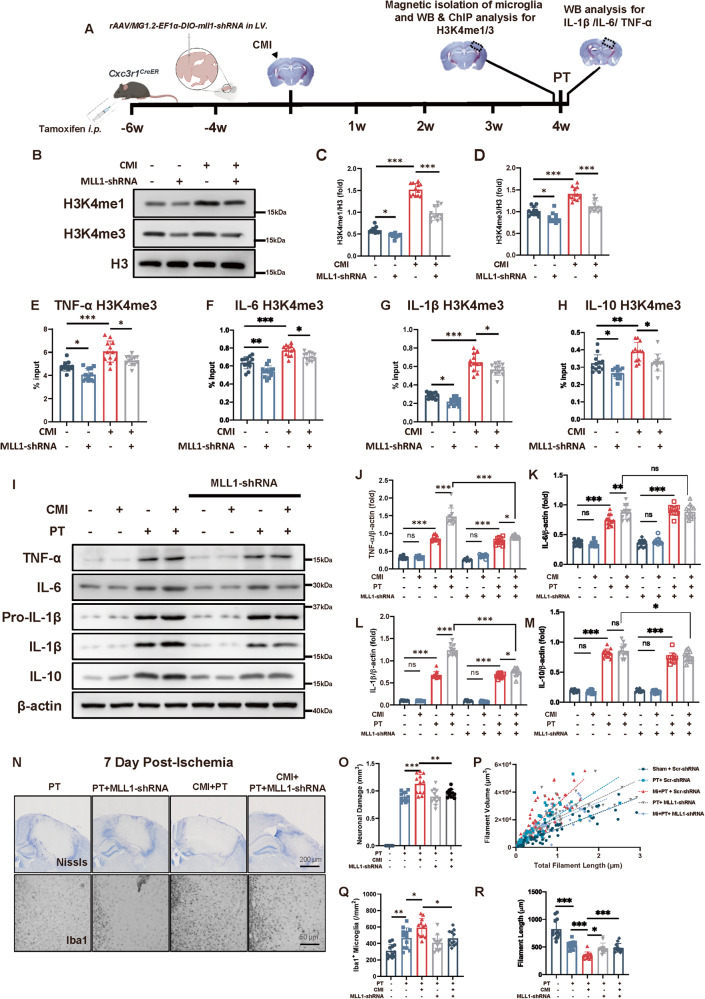
Fig. 3. Inhibition of H3 methylation abolished the detrimental effect of CMI on recurrent PT stroke.
A Schematic diagram of experimental design. B–D Immunoblots and quantitative analysis of H3K4me1/3 showing microglial H3K4me1/3 expression in contralateral mouse cortex subjected to CMI and MLL1-shRNA treatment, n = 12 mice per group. Two-way ANOVA, for interaction: p < 0.0001. So, t-tests were used to detect the difference between groups. Sham vs. CMI: p < 0.0001; CMI vs. CMI+ MLL1-shRNA: p < 0.0001 (C) For interaction: p = 0.0774. For MLL1-shRNA factor: p < 0.0001. For CMI factor: p < 0.0001. Sham vs. CMI: p < 0.0001; CMI vs. CMI+ MLL1-shRNA: p < 0.0001 (D) with Turkey’s correction. Quantitative analysis of H3K4me3 ChIP-qPCR on TNF-α (E), IL-6 (F), IL-1β (G), and IL-10 (H) promoters in contralateral microglia 4 weeks after CMI and MLL1-shRNA treatment, n = 12 mice per group. Two-way ANOVA, for interaction p = 0.8532. For MLL1-shRNA factor, p < 0.0001. CMI vs. CMI+ MLL1-shRNA: p = 0.0129 (E); For interaction p = 0.3404. For MLL1-shRNA factor, p < 0.0001. CMI vs. CMI+MLL1-shRNA: p = 0.0238 (F); For interaction p = 0.7885. For MLL1-shRNA factor, p = 0.0002. CMI vs. CMI+ MLL1-shRNA: p = 0.0165 (G); For interaction p = 0.2121. For MLL1-shRNA factor, p = 0.0645. CMI vs. CMI+MLL1-shRNA: p = 0.9701 (H) with Tukey’s correction. I–M Immunoblots and quantitative analysis of TNF-α (J), IL-6 (K), IL-1β (L), and IL-10 (M) showing pro-inflammatory cytokine expression in peri-infarct region 12 h after PT stroke, n = 12 mice per group. Three-way ANOVA. For interaction, p < 0.0001. So, t-tests were used to detect the difference between groups. PT vs. CMI+PT: p < 0.0001; CMI+PT vs. CMI+PT+MLL1-shRNA: p < 0.0001 (J); For interaction, p = 0.0026. So, t-tests were used to detect the difference between groups. PT vs. CMI+PT: p = 0.0056; CMI+PT vs. CMI+PT+MLL1-shRNA: p = 0.8656 (K); For interaction, p < 0.0001. So, t-tests were used to detect the difference between groups. PT vs. CMI+PT: p < 0.0001; CMI+PT vs. CMI+PT+MLL1-shRNA: p < 0.0001 (L) For interaction, p = 0.7475. PT vs. CMI+PT: p = 0.7733; CMI+PT vs. CMI+PT+MLL1-shRNA: p = 0.0188 (M) with Tukey’s correction. Representative Nissl and Iba1 IHC staining (N) and quantitative analysis of infarct size and microglial activation (O–R) showing PT stroke exacerbated by CMI was potentially mitigated by H3 methylation inhibition, n = 12 mice per group. Two-way ANOVA. For interaction, p = 0.0205. So, t-tests were used to detect the difference between groups. CMI+PT vs. CMI+PT+MLL1-shRNA: p = 0.0046 (O); For interaction, p = 0.2487. CMI+PT vs. CMI+PT+ MLL1-shRNA: p = 0.0228 (Q); For interaction, p < 0.0001. So, t-tests were used to detect the difference between groups. CMI+PT vs. CMI+PT++ MLL1-shRNA: p = 0.0001 (R) with Tukey’s correction. Scale bar, 200 μm for Nissl staining and 50 μm for Iba1 staining. Data are presented as mean ± standard deviation (SD), *p < 0.05, **p < 0.01, ***p < 0.001, n.s., non-significant.

