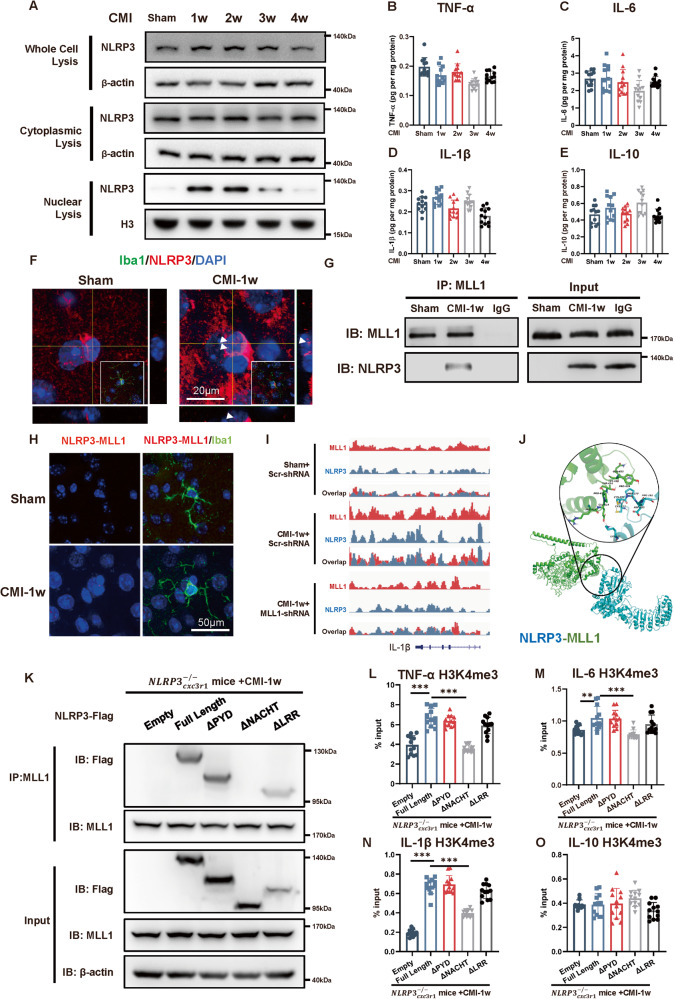
Fig. 4. CMI-induced interaction of NLRP3 with MLL1 in contralateral cortex.
A Immunoblots of NLRP3 expression in microglial whole-cell, cytoplasmic, and nuclear lysis after CMI, n = 12 mice per group. Quantitative ELISA analysis of TNF-α (B), IL-6 (C), IL-1β (D) and IL-10 (E) expression in the contralateral side of CMI showing that CMI did not influence the inflammatory cytokines expression in the chronic phase of CMI. (n = 12 mice per group). One-way ANOVA F 4, 55 = 8.251, p < 0.0001. Sham vs. CMI1w: p = 0.0867; Sham vs. CMI 2w: p = 0.9064; Sham vs. CMI 3w: p < 0.0001; Sham vs. CMI 4w: p = 0.0331 (B); F 4, 55 = 3.113, p = 0.0222. Sham vs. CMI1w: p = 0.9992; Sham vs. CMI 2w: p = 0.9211; Sham vs. CMI 3w: p = 0.0390; Sham vs. CMI 4w: p = 0.9554 (C); F4, 55 = 10.62, p < 0.0001. Sham vs. CMI1w: p = 0.2167; Sham vs. CMI 2w: p = 0.5763; Sham vs. CMI 3w: p = 0.9177; Sham vs. CMI 4w: p = 0.0027 (D); F4, 55 = 4.098, p = 0.0056. Sham vs. CMI1w: p = 0.4233; Sham vs. CMI 2w: p > 0.9999; Sham vs. CMI 3w: p = 0.0266; Sham vs. CMI 4w: p = 0.9984 (E) with Tukey’s correction. F Representative immunofluorescence images of NLRP3 (red) expression in microglia (iba1, green) one week after CMI. Scale bars, 20 μm. G Immunoprecipitation and immunoblot analysis of MLL1 and NLRP3 in microglial lysates from mice subjected to sham and CMI. Lysates were immunoprecipitated by anti-MLL1 (IP) or immunoglobulin control (IgG) or directly subjected to immunoblot (Input), n = 3 mice per group. H Proximity ligation assay of microglial (iba1, green) NLRP3 and MLL1 (red dots) in sham and one-week post-CMI mice. Scale bars, 20 μm. I ChIP-seq analysis of NLRP3 and MLL1 binding to IL-1β in one-week post-CMI mice. J Representative images of sequence alignments showing interaction of NLRP3 (blue) with MLL1 (green). K Immunprecipitation and immunoblot analysis of MLL1 and Flag in microglial lysates from Cxc3r1CreER mice transfected with 3xFlag-NLRP3 or truncated mutants (ΔPYD, ΔNACHT, ΔLRR) and subjected to CMI surgery. Lysates were immunoprecipitated by anti-MLL1 (IP) or immunoglobulin control (IgG) or directly subjected to immunoblot (Input), n = 3 mice per group. Quantitative analysis of H3K4me3 ChIP-qPCR on TNF-α (L), IL-6 (M), IL-1β (N), and IL-10 (O) promoters in contralateral microglia one week after CMI. Cxc3r1CreER mice transfected with 3xFlag-NLRP3 or truncated mutants (ΔPYD, ΔNACHT, ΔLRR) and subjected to CMI surgery. One-way ANOVA, F 4, 55 = 42.25, p < 0.0001;Empty vs Full Length, p < 0.0001; Full Length vs ΔPYD: p = 0.7675; Full length vs ΔNACHT, p < 0.0001; Full Length vs ΔLRR: p = 0.1030 (L); F 4, 55 = 8.732, p < 0.0001; Empty vs. Full Length, p = 0.0077; Full Length vs ΔPYD: p = 0.9998; Full length vs ΔNACHT, p = 0.0001; Full Length vs. ΔLRR: p = 0.3921(M); F 4, 55 = 122.5, p < 0.0001;Empty vs. Full Length, p < 0.0001; Full Length vs ΔPYD: p = 0.9868; Full length vs. ΔNACHT, p < 0.0001; Full Length vs. ΔLRR: p = 0.2638 (N); F 4, 55 = 2.246, p = 0.0758; Empty vs Full Length, p > 0.9999; Full Length vs ΔPYD: p = 0.9988; Full length vs ΔNACHT, p = 0.5413; Full Length vs. ΔLRR: p = 0.6035(O). n = 12 mice per group. Data are presented as mean ± standard deviation (SD). *p < 0.05, **p < 0.01, ***p < 0.001, n.s., non-significant.

