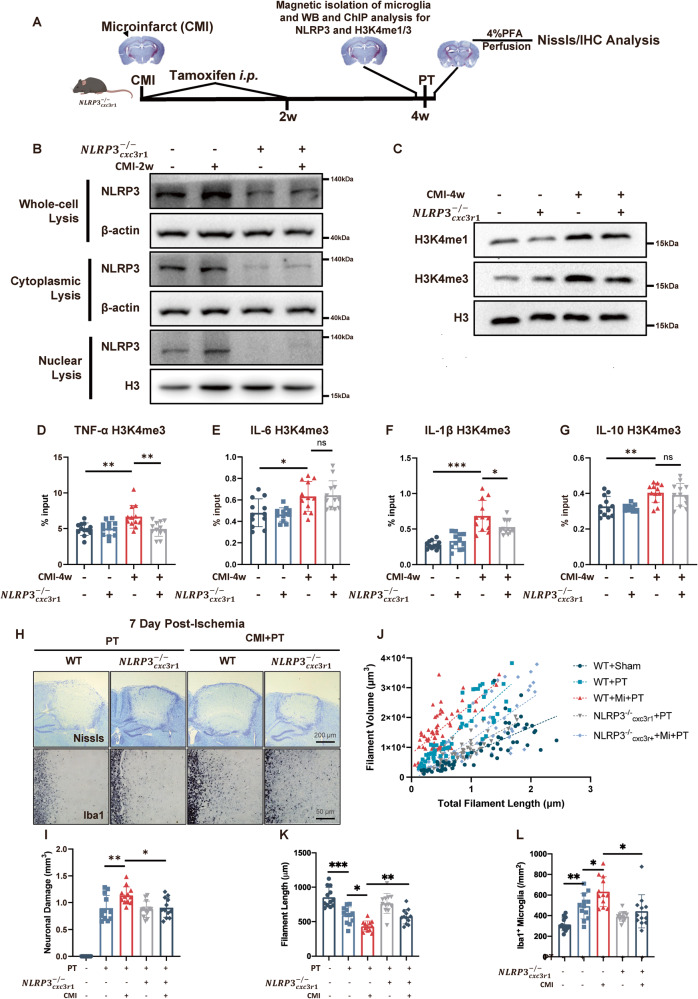
Fig. 5. Knockout of microglial NLRP3 mitigated MLL1, reduced H3 methylation, and attenuated CMI-induced detrimental effects on recurrent stroke.
A Schematic diagram of experimental design. B Immunoblot of microglial NLRP3 expression in WT and mice four weeks after CMI induction, n = 12 mice per group. C Immunoblot of microglial H3K4me1/3 expression in WT and mice four weeks after CMI induction, n = 12 mice per group. Quantitative analysis of H3K4me3 ChIP-qPCR on TNF-α (D), IL-6 (E), IL-1β (F), and IL-10 (G) promoters among contralateral microglia four weeks after CMI induction in WT and mice, n = 12 mice per group. Two-way ANOVA, for interaction: p = 0.0110. So, t-tests were used to detect the difference between groups. CMI vs. CMI+: p = 0.0053 (D); For interaction: p = 0.7059. CMI vs. CMI+: p = 0.9965 (E); For interaction: p = 0.0106. So, t-tests were used to detect the difference between groups. CMI vs. CMI+: p = 0.0341 (F); For interaction: p = 0.0003. So, t-tests were used to detect the difference between groups. CMI vs. CMI+: p = 0.6246 (G) with Tukey’s correction. Representative Nissl and Iba1 IHC staining (H) and quantitative analysis of infarct size and microglial activation (I–L) showing that NLRP3 blockade in microglia after CMI abolished the exacerbated infarct size and microglial activation by CMI, n = 12 mice per group. Two-way ANOVA, for interaction: p = 0.6293. CMI vs. CMI+: p = 0.0231 (I), for interaction: p = 0.2277. CMI vs CMI+: p = 0.0034 (K), for interaction: p = 0.0617. CMI vs. CMI+: p = 0.0229 (L) with Tukey’s correction. Data are presented as mean ± standard deviation (SD), *p < 0.05, **p < 0.01, ***p < 0.001, n.s. non-significant.

