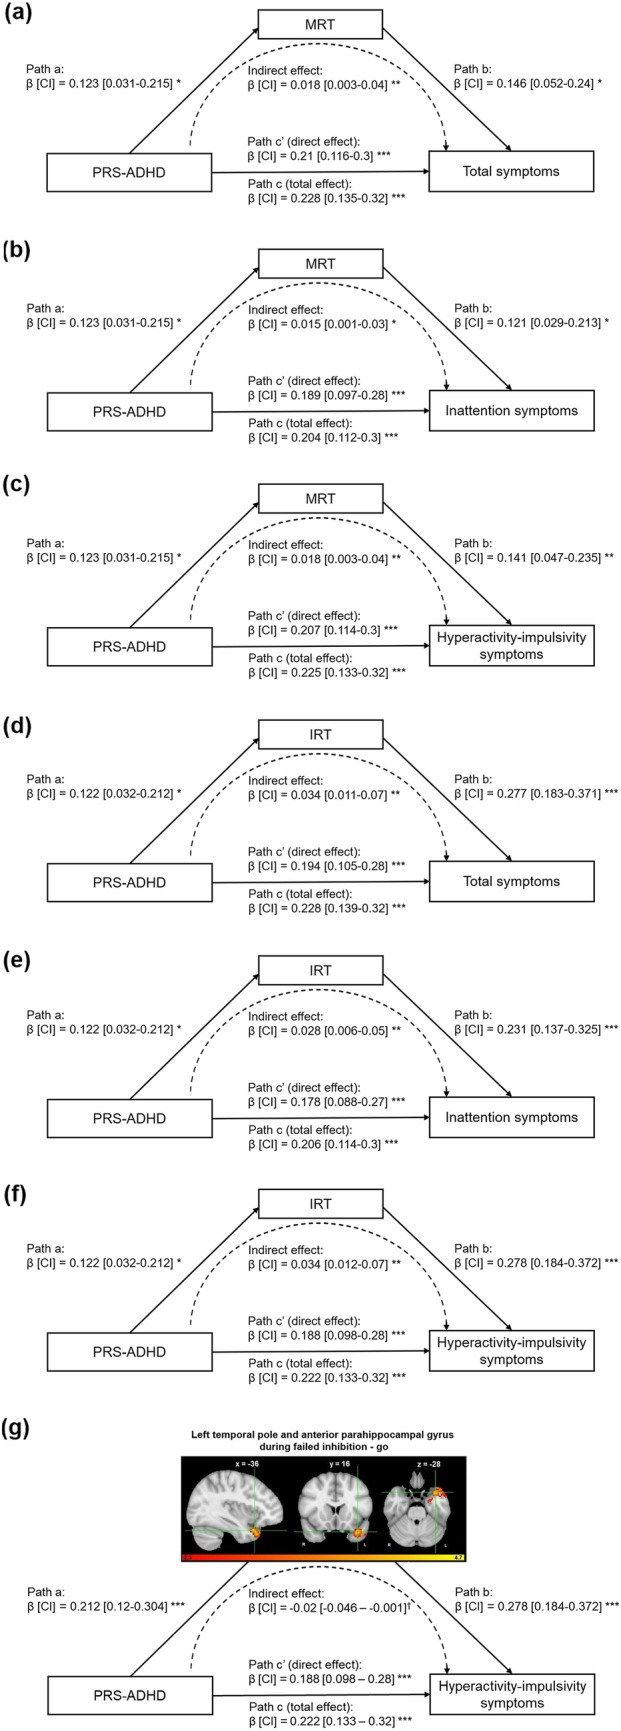
Fig. 2.

Path diagrams (including standardized regression coefficients and 95% confidence intervals) of the mediation analyses demonstrating that the associations between polygenic risk score for ADHD at p-value threshold of 1 (PRS-ADHD) and total ADHD (a, d), inattention (b, e), and hyperactivity-impulsivity symptom scores (c, f, g) are mediated by mean reaction time (MRT) (a–c), intra-individual coefficient of variation of reaction time (IRT) (d–f), and cluster-average activity in the left temporal pole and anterior parahippocampal gyrus during failed inhibition (g). Path “a” represents the effect of PRS-ADHD on the mediator. Path “b” represents the impact of the mediator on ADHD symptom scores controlling for the PRS-ADHD effect. Together, Path “a” and Path “b” represent the indirect (mediated) effect of PRS-ADHD on ADHD symptom scores through the mediator. Path “c” represents the direct effect of PRS-ADHD on ADHD symptom scores and is calculated controlling for the indirect, mediated effect. Path “c” represents the total (mediated and direct) effect of PRS-ADHD on ADHD symptom scores. The asterisks indicate significance using FDR-correction († p-uncorrected < 0.05, * p-FDR < 0.05, ** p-FDR < 0.01, *** p-FDR < 0.001). See also Supplementary Tables 4–5. β, standardized regression coefficients; CI, 95% confidence intervals
