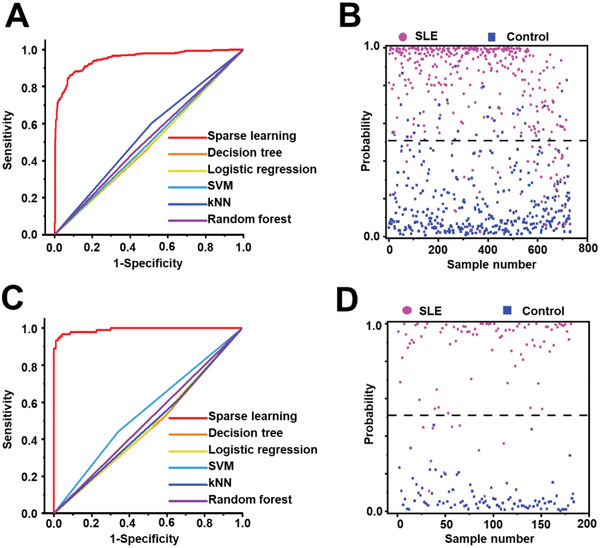
Figure 2.

Differentiation of SLE from HCs by machine learning methods. A) ROC curves based on the 731 SMFs (SLE/HC, 357/374) in the discovery cohort, using sparse learning (AUC of 0.950), decision tree (AUC of 0.486), logistic regression (AUC of 0.489), supporting vector machine (SVM, AUC of 0.498), K‐nearest neighbors (kNN, AUC of 0.544), and random forest (AUC of 0.513). B) The scatter plot of probability in the discovery cohort is based on the optimized diagnostic model of sparse learning. C) ROC curve based on the 184 SMFs (SLE/HC, 91/93) in the validation cohort, using sparse learning (AUC of 0.992), decision tree (AUC of 0.533), logistic regression (AUC of 0.527), SVM (AUC of 0.450), kNN (AUC of 0.523), and random forest (AUC of 0.499). D) The scatter plot of probability in the validation cohort is based on the optimized diagnostic model of sparse learning. Every dot in (B) and (D) represents one individual in this study.
