Figure 3.

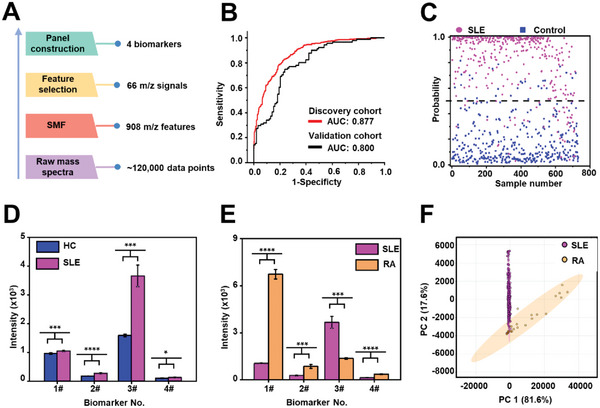
Construction of metabolic biomarker panel of SLE. A) Workflow for constructing the metabolic biomarker panel. After the pretreatment of raw mass spectra (containing 120 000 data points), the SMF of 908 m/z features was extracted, yielding 66 m/z signals through the feature selection process, thus identifying 4 biomarkers. B) The ROC curves by sparse learning of the 4 biomarkers in the discovery cohort (red line) and validation cohort (black line). C) The scatter plot of probability in discovery cohort based on the optimized diagnostic model of SMFs. D) The intensity plot of SLE patients (in pink) and HCs (in green) is based on the 4 biomarkers, according to five independent LDI MS experiments. E) The intensity plot of 357 SLE patients (in pink) and 27 rheumatoid arthritis (RA) patients (in yellow) based the 4 biomarkers, according to five independent LDI MS experiments (* represents p < 0.05, ** represents p < 0.01, *** represents p < 0.001, and **** represented p < 0.0001). F) The scores plot of SLE patients and RA patients by principal component analysis (PCA).
