Figure 1.

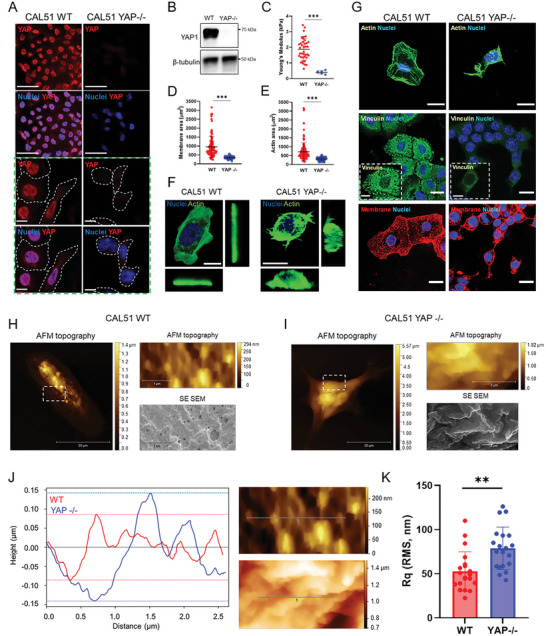
YAP depletion affects CAL51 adhesion, mechanics, morphology, and membrane properties. A) Representative confocal images depicting YAP expression in WT or YAP ‐/‐ CAL51 cells. Cells were stained for YAP (AF555, red), and nuclei were counterstained with DAPI (blue). Scale bar: 50 µm. The green dashed line box shows higher magnification pictures. Scale bar: 10 µm. B) Western blot analysis showing the levels of YAP protein in WT or YAP ‐/‐ CAL51 cells. β‐tubulin was used for protein loading normalization. C) Dot plot representation of the Young's modulus analysis of WT or YAP ‐/‐ CAL51 cells as measured by atomic force microscopy (AFM). WT CAL51: n = 80; YAP ‐/‐ CAL51: n = 10. Statistical analysis was performed by unpaired t‐test with Welch's correction; *** p < 0.001. D) Dot plot analysis of WT or YAP ‐/‐ CAL51 total membrane area. Cells were stained with Alexa Fluor 488‐labeled wheat germ agglutinin (WGA‐488, green). n > 100 cells. Statistical analysis was performed by unpaired t‐test with Welch's correction; *** p < 0.001. E) Dot plot analysis of WT or YAP ‐/‐ CAL51 cell surface area calculated based on the total actin coverage of the cells. Cells were stained with Alexa Fluor 488‐labeled Phalloidin (Pha‐488, green). n > 100. Statistical analysis was performed by unpaired t‐test with Welch's correction; *** p < 0.001. F) CAL51 WT (left) and YAP ‐/‐ cells (right) 3D reconstruction. Cells were stained with DAPI and WGA‐488 (green). Scale bar: 20 µm. G) Representative confocal images of WT or YAP ‐/‐ CAL51 cells stained for nuclei (DAPI, blue) and actin (Pha‐488, green, top), vinculin (AF488, green, middle), and membrane (WGA‐647, red, bottom), respectively. Scale bar: 20 µm. The insets display high‐magnification images. Scale bar: 10 µm. Correlative Probe and Electron Microscopy (CPEM) imaging of CAL51 WT (H) and CAL51 YAP ‐/‐ (I) cells. AFM and SEM images are shown. White dashed line boxes indicate the detail of the magnifications shown as AFM and SEM images on the right of each main micrograph. J) Plot displaying the profile of the membrane roughness as determined for WT (red) and YAP ‐/‐ (blue) CAL51 cells in the region highlighted in the SEM images on the right (red dashed line, top for CAL51 WT; blue dashed line, bottom for YAP ‐/‐ CAL51). The roughness profile was calculated on the deconvolved images. Scale bar: 0.5 µm. K) Mean square roughness of the height irregularity (R q) measured on WT (red) and YAP ‐/‐ (blue) CAL51cells. n = 20. Statistical analysis was performed by unpaired t‐test with Welch's correction; ** p < 0.01.
