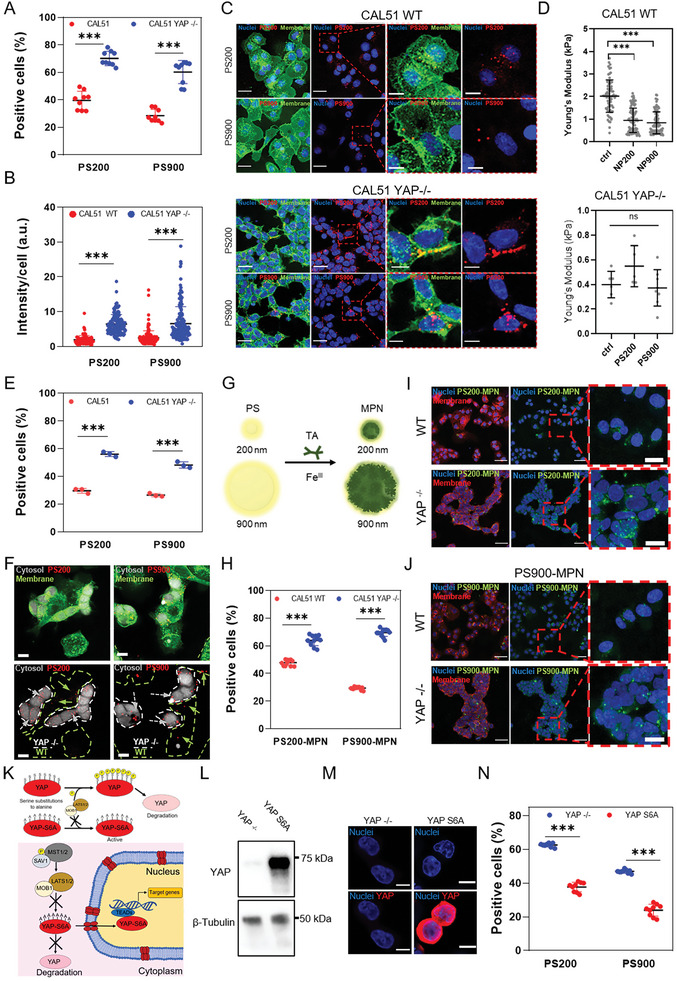
Figure 3.

YAP knockout promotes nanoparticle binding and internalization in CAL51 TNBC cells. A) 4‐hour cellular uptake of PS200 and PS900 in WT (red) and YAP ‐/‐ CAL51 (blue). Statistical analysis was performed using the two‐way ANOVA followed by Sidak's multiple comparisons test. n = 3; *** p < 0.001. B) Nanoparticle intensity per cell after 4 h of incubation of CAL51 WT and YAP ‐/‐ cells with PS200 and PS900. Statistical analysis was performed using the two‐way ANOVA followed by Sidak's multiple comparisons test. n = 3; *** indicates p < 0.001. n > 100 cells. C) Confocal images of WT (top) and YAP ‐/‐ (bottom) CAL51 cells after 4 h of incubation with PS200 and PS900. Cells were stained with WGA‐488 (green) and/or DAPI (blue). Magnified images are displayed inside the red dashed line boxes for each cell and particle type. Scale bar: 25 and 10 µm. D) Young's modulus analysis of WT (top) and YAP ‐/‐ (bottom) cells after 4 h of incubation with PS200 and PS900, as measured by atomic force microscopy (AFM). Statistical analysis was performed using the Kruskal–Wallis one‐way ANOVA followed by Dunn's multiple comparisons test. WT CAL51: n = 80; YAP ‐/‐ CAL51: n = 10; *** p < 0.001; ns, non‐significant. E) 4‐hour cellular uptake of PS200 and PS900 in a co‐culture of WT (red) and YAP ‐/‐ (blue) CAL51. Statistical analysis was performed using the two‐way ANOVA followed by Sidak's multiple comparisons test. n = 3; *** p < 0.001. F) Confocal images of WT and YAP ‐/‐ cells co‐culture in the presence of PS200 and PS900 for 4 h. White dashed line indicates CAL51 YAP ‐/‐ cells. Grey arrows indicate particles co‐localized with YAP ‐/‐ cells (encircled by white dashed lines), while green arrows indicate particles in contact with WT cells (encircled by green dashed lines). CAL51 YAP ‐/‐ cells are stained with 7‐amino‐4‐chloromethylcoumarin (grey) and whole cell population with WGA‐488 (green). Scale bar: 10 µm. G) The surface properties of PS200 and PS900 were modified by MPN coating, using tannic acid and FeCl3. H) 4‐hour cellular uptake of PS200‐MPN and PS900‐MPN for WT (red) and YAP ‐/‐ (blue) CAL51. Statistical analysis was performed using the two‐way ANOVA followed by Sidak's multiple comparisons test. n = 3; *** p < 0.001. I,J) Confocal images of WT (top) and YAP ‐/‐ (bottom) CAL51 cells after 4 h of incubation with PS200 (I) and PS900 (J). Cells are stained with WGA‐647 (red) and DAPI (blue). The particles are displayed in green. Magnified images are displayed inside red dashed line boxes for each cell and particle type. Scale bar: 50 and 10 µm. K) Schematic representation of the phosphorylation‐mediated repression of YAP translocation to the nucleus by kinases involved in different pathways, mainly Hippo pathway (LATS1/2 kinases and scaffolding protein MOB1). Due to substitutions of serine residues with alanine residues in six different positions (S61A, S109A, S127A, S128A, S131A, S136A, S164A, and S381A), YAP‐S6A cannot be phosphorylated by upstream kinases, thus is constitutively active in the cell nucleus. L) Western blot analysis of the levels of YAP protein in CAL51 YAP ‐/‐ and in cells transfected with a plasmid carrying a copy of the YAPS6A gene. β‐tubulin was used for protein loading normalization. M) Confocal images of YAP ‐/‐ (CTRL) and YAPS6A CAL51. Cells were stained with DAPI (blue) and YAP (AF555, red). Scale bar: 10 µm. N) 4‐hour cellular uptake of PS200 and PS900 in YAP ‐/‐ (blue) and YAPS6A (red) CAL51. Statistical analysis was performed using the two‐way ANOVA followed by Sidak's multiple comparisons test. n = 3; *** p < 0.001.
