Figure 5.

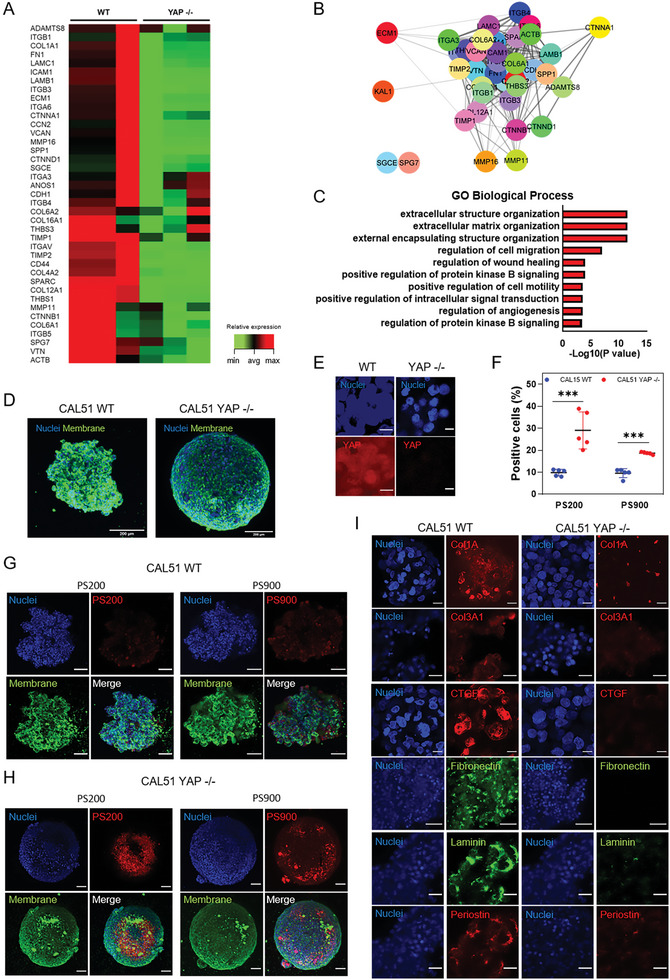
YAP knockdown affects nanoparticle binding and ECM deposition in 3D CAL51 spheroids. A) Heatmap representing the changes in expression for ECM and cell adhesion molecules in YAP ‐/‐ compared to WT CAL51 cells, as obtained from RT2‐profiler PCR array analysis (P adj < 0.05, fold change 2). B) STRING PPI network of differently expressed ECM proteins in CAL51 WT obtained from Cytoscape (P adj < 0.05, log2Fc > ǀ2ǀ, confidence cutoff 0.4). C) Bar plot representation of common enriched biological processes and pathways related to ECM network from the ENRICHR database, showing the most significantly upregulated genes in WT compared to YAP ‐/‐ CAL51 cells (P adj < 0.05, log2Fc > ǀ2ǀ). D) Z‐projection images of WT (left) and YAP ‐/‐ CAL51 (right) spheroids after 5 days of culture. Cells are stained with WGA‐488 (green) and DAPI (blue). Scale bar: 200 µm. E) Confocal images of the spheroids derived from WT and YAP ‐/‐ cells. Cells were stained with DAPI (blue) and YAP (AF555, red). Scale bar: 10 µm. F) 4‐hour cellular uptake of PS200 and PS900 in WT (red) and YAP ‐/‐ (blue) CAL51 spheroids. Statistical analysis was performed using the two‐way ANOVA followed by Sidak's multiple comparisons test. n = 5; *** p < 0.001. G) Confocal images of the spheroids derived from WT CAL51 cells incubated with PS200 (left) and PS900 (right) for 4 h. H) Representative confocal images of the spheroids derived from YAP‐/‐ CAL51 cells incubated with PS200 (left) and PS900 (right) for 4 h. Cells were stained with WGA‐488 (green) and DAPI (blue). Nanoparticles are shown in red. Scale bar: 100 µm. I) Representative confocal images of the indicated ECM components for the spheroids derived from WT (left) and YAP ‐/‐ (right) CAL51 cells. Collagen type 1 alpha (Col1A), collagen type III alpha 1 (Col3A1), connective tissue growth factor (CTGF), and periostin are stained with 2nd antibody labeled with AF‐555 (red); fibronectin and laminin are stained with II‐antibody labeled with AF‐488 (green). Scale bar: 25 µm.
