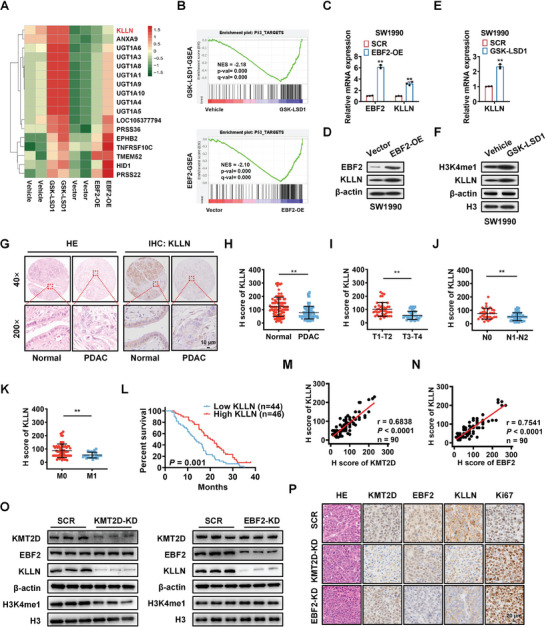
Figure 4.

KLLN is a common transcriptional target of KMT2D and EBF2 in PDAC cells. A) Heatmaps from RNA‐seq data showing overlapping of differentially expressed genes (DEGs) of SW1990‐luc cells with EBF2 overexpression (EBF2‐OE) or H3K4me1 activation by GSK‐LSD1. B) Gene Set Enrichment Analysis (GSEA) reveals that the DEGs are enriched in genes regulated by p53. C, D) The mRNA (C) and protein (D) levels of EBF2 and KLLN in negative control (Vector) and EBF2 overexpressed (EBF2‐OE) SW1990 cells verified by qPCR and Western blot analysis. Data in C are presented as mean ± SEM, ** p < 0.01 by Student's t‐test. E,F) The mRNA (E) and protein (F) levels of KLLN in negative control (Vector) and GSK‐LSD1‐treated SW1990 cells verified by qPCR and Western blot analysis. Data in E are presented as mean ± SEM, ** p < 0.01 by Student's t‐test. G) H&E and IHC staining of KLLN protein in PDAC and adjacent normal tissues. Scale bar, 10 µm. H) H score of KLLN in PDAC and tumor adjacent tissues. I–K) Correlations of KLLN expression with tumor stage (I), lymph node metastasis (J), and distal metastasis (K) in PDAC patients. Data in I–K are presented as mean ± SEM, ** p < 0.01 by Student's t‐test. L) Kaplan–Meier plot of overall survival of 90 patients with PDAC, stratified by KLLN expression (Log‐rank test, p = 0.001). M) Spearman correlation analysis of KMT2D and KLLN levels in PDAC tissues (n = 90, r = 0.6838, p < 0.0001). N) Spearman correlation analysis of EBF2 and KLLN levels in PDAC tissues (n = 90, r = 0.7541, p < 0.0001). O) Western blot analysis of KLLN and H3K4me1 levels in SCR, KMT2D‐KD, or EBF2‐KD xenografts. P) H&E and IHC staining of KLLN and Ki67 in SCR, KMT2D‐KD, or EBF2‐KD xenografts. Scale bar, 20 µm.
