
Figure 6.
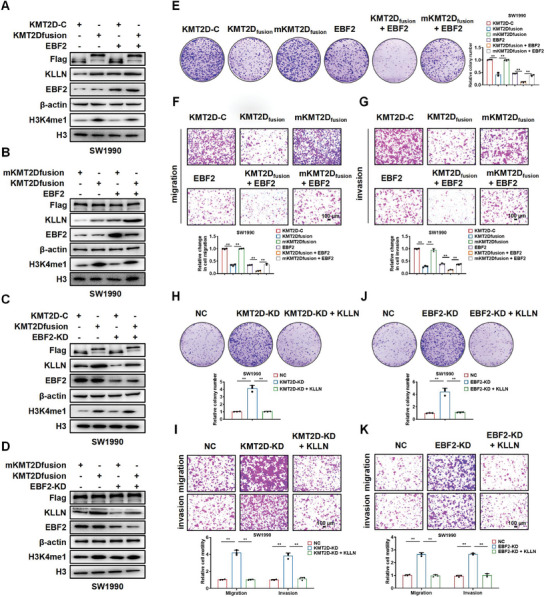
KMT2D and EBF2 cooperate to regulate the expression of KLLN. A) Western blot of KLLN and H3K4me1 in SW1990 cells transfected with KMT2D‐C, KMT2Dfusion, or EBF2. B) Western blot of KLLN and H3K4me1 in SW1990 cells transfected with mKMT2Dfusion, KMT2Dfusion or EBF2. C) Western blot of KLLN and H3K4me1 in SW1990 cells transfected with KMT2D‐C, KMT2Dfusion or EBF2‐KD. D) Western blot of KLLN and H3K4me1 in SW1990 cells transfected with mKMT2Dfusion, KMT2Dfusion, or EBF2‐KD. β‐actin and H3 were used as loading control. E–G) Colony‐formation (E), migration (F), and invasion (G) of SW1990 cells treated with KMT2D‐C, KMT2Dfusion, mKMT2Dfusion, EBF2, KMT2Dfusion+EBF2, mKMT2Dfusion+EBF2. H,I) Colony‐formation assays (H) and Transwell (I) assays of SW1990 cells transfected with control (NC), KMT2D‐KD or KMT2D‐KD + KLLN. J‐K) Colony‐formation assays (J) and Transwell (K) assays of SW1990 cells transfected with control (NC), EBF2‐KD or EBF2‐KD+KLLN. Scale bar,100 µm. Data in E–K are presented as mean ± SEM, ** p < 0.01 by one‐way ANOVA test.