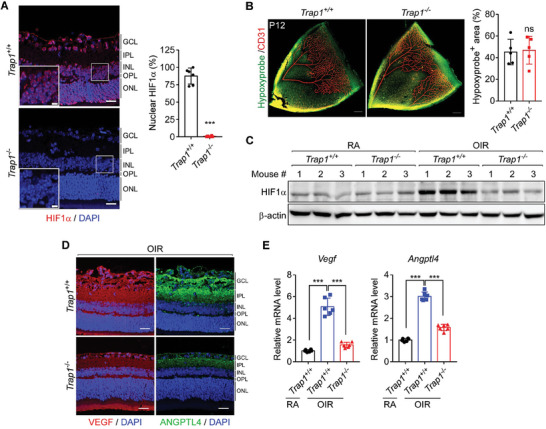
Figure 2.

Regulation of HIF1α stability and angiogenic factor expression by TRAP1. A) HIF1α expression in P17 OIR mouse retinas. Left. Retinal sections collected from Trap1 +/+ and Trap1 −/− OIR mice were stained with an anti‐HIF1α antibody (red) and DAPI (blue), and imaged by confocal microscopy. Scale bars, 20 µm and 5 µm (inset). Right Quantification of the ratio (%) of HIF1α/DAPI double‐positive areas to DAPI‐positive areas (n = 6 mice/group). B) Identification of hypoxic areas in P12 OIR mouse retinas. Left. Whole‐mount retinas were stained with Hypoxyprobe (green) and an anti‐CD31 antibody (red) to visualize hypoxic regions and blood vessels, respectively. Scale bar, 200 µm. Right. Quantification of hypoxic areas. Hypoxyprobe‐positive areas were quantified from the obtained images (n = 5 mice/group). C) Expression of HIF1α in P12 control (RA) and OIR mouse retinas. Western blot analysis was performed to measure HIF1α expression in the retinas of Trap1 +/+ and Trap1 −/− RA and OIR mice (n = 3 mice/group). D) VEGF and ANGPTL4 expression in mouse P17 OIR retinas. Retinal sections from Trap1 +/+ and Trap1 −/− OIR mice were stained with anti‐VEGF (red) and anti‐ANGPTL4 (green) antibodies, and analyzed by confocal microscopy (n = 3 mice/group). Scale bar, 20 µm. E) Quantitation of Vegf and Angptl4 mRNAs in P17 OIR mouse retinas. mRNA levels in control (RA) and OIR Trap1 +/+ and Trap1 −/− mouse retinas were analyzed by qPCR and compared (n = 6; duplicate experiment of 3 mice/group). Data information: Data are expressed as mean ± SEM. Student t‐test, *** P < 0.001; ns, not significant.
