Figure 3.

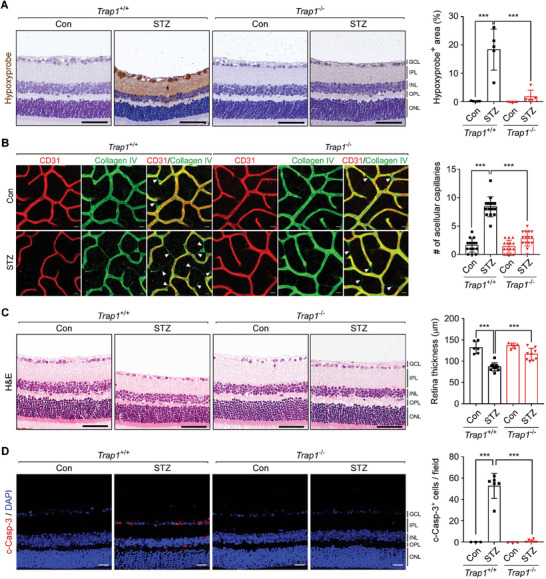
Trap1 KO decreases vascular abnormalities in STZ mice. A) Hypoxyprobe staining of the retinas of 16‐week post‐STZ injection Trap1 +/+ and Trap1 −/− mice of 25 weeks old (Figure S6A, Supporting information). Left. Retinal sections of Trap1 +/+ and Trap1 −/− STZ mice were analyzed by Hypoxyprobe staining. Scale bar, 50 µm. Right. Quantitation of Hypoxyprobe‐positive areas (n = 5 mice/group). B) Decreased retinal capillary degeneration in Trap1 −/− STZ mice. Left. STZ and control (Con) retinas from Trap1 +/+ and Trap1 −/− mice were flat‐mounted and stained with anti‐CD31 (red) and anti‐collagen IV antibodies (green) to visualize blood vessels and basement membranes, respectively. White triangles indicate acellular capillaries. Scale bar, 20 µm. Right. Quantification of acellular capillaries. The number of acellular capillaries was counted in each microscopic field (n = 15; 5 mice/group, 3 fields/mouse). C) Thinning of STZ mouse retinas. Left. Retinal sections collected from Trap1 +/+ and Trap1 −/− STZ mice were analyzed by H&E staining. Scale bar, 50 µm. Right. Quantification of retinal thickness (control n = 6, STZ n = 10 mice/group). D) Cell death in STZ mouse retinas. Left. Retinal sections of Trap1 +/+ and Trap1 −/− STZ mice were analyzed by cleaved caspase‐3 (c‐Casp‐3, red) staining. Scale bar, 20 µm. Right. Quantification of c‐Casp‐3‐positive cells in STZ mouse retinas (control n = 3, STZ n = 6 mice/group). Data information: Data are expressed as mean ± SEM. Student t‐test, *** P < 0.001.
