Figure 4.

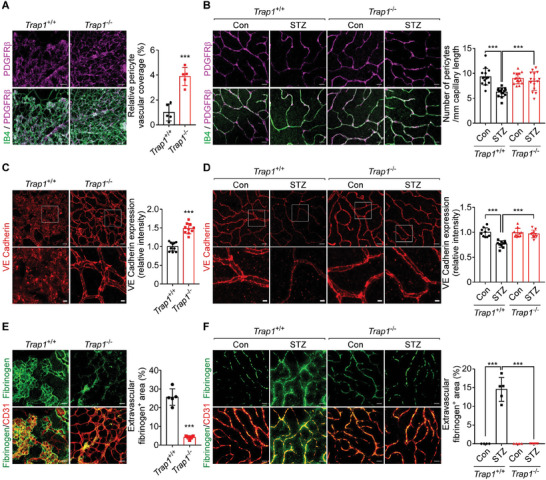
TRAP1 regulation of vascular organization and permeability. A) Pericyte vascular coverage in P17 OIR mouse retinas. Left. Whole‐mount retinas collected from Trap1 +/+ and Trap1 −/− P17 OIR mice were stained with an anti‐PDGFR‐β antibody (magenta) and IB4 (green) to label PCs and ECs, respectively, and analyzed by confocal microscopy. Scale bar, 50 µm. Right. The ratio of the PDGFR+ area to the IB4+ area was calculated to measure pericyte coverage in vascularized areas (n = 5 mice/group). Neovascular tufts were not included in analysis. B) Pericyte coverage in STZ mouse retinas. Left. Whole‐mount retinas collected from STZ mice were analyzed by confocal microscopy as in (A). Scale bar, 20 µm. Right. The number of PCs per millimeter of capillary length was counted (n = 15; 5 mice/group, 3 fields/mouse). C) Endothelial junction integrity in P17 OIR mouse retinas. Left. Whole‐mount retinas collected from Trap1 +/+ and Trap1 −/− OIR mice were stained with an anti‐VE‐cadherin antibody to visualize adherens junctions. Scale bars, 20 µm (top) and 5 µm (bottom). Right. The intensities of VE‐cadherin staining were calculated and compared (n = 10; 4 mice/group, 2–3 fields/mouse). D) Endothelial junction integrity in STZ mouse retinas. Left. Whole‐mount retinas collected from STZ mice were analyzed by confocal microscopy as in (C). Scale bar, 20 µm (top) and 5 µm (bottom). Right. Quantification of VE‐cadherin staining intensity (n = 10; 4 mice/group, 2–3 fields/mouse). E) Vascular leakage in P17 OIR mouse retinas. Left. Whole‐mount retinas collected from Trap1 +/+ and Trap1 −/− OIR mice were stained with anti‐fibrinogen (green) and anti‐CD31 (red) antibodies. Scale bars, 50 µm. Right. Quantification of fibrinogen signals (n = 5 mice/group, 1 field/mouse). F) Vascular leakage in STZ mouse retinas. Left. Whole‐mount retinas collected from STZ mice were analyzed by confocal microscope as in (E). Scale bars, 10 µm. Right. Quantification of fibrinogen signal (n = 4–5; 4 mice/group, 1–2 fields/mouse). Data information: Data are expressed as mean ± SEM. Student t‐test, *** P < 0.001.
