Figure 7.

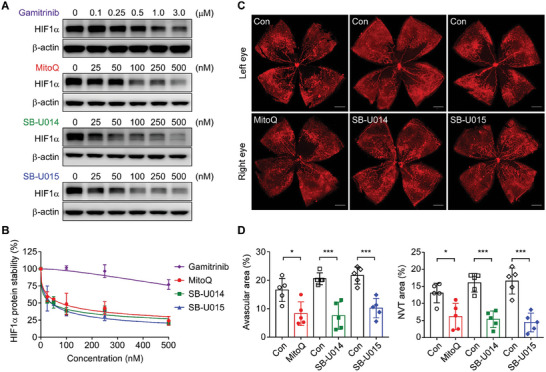
Normalized retinal vascularization upon topical application of TRAP1 inhibitors. A) HIF1α degradation induced by TRAP1 inhibitors. MIO‐M1 cells were incubated with various concentrations of TRAP1 inhibitors as indicated for 6 h under hypoxia and analyzed by western blotting. B) Quantification of HIF1α protein degradation. The HIF1α band intensities in western blot data obtained as in (A) were analyzed and compared. The data are mean ± SEM from four independent experiments. C) Vascular structure of P17 OIR mouse retinas after topical drug application. Vehicle and 2 mM TRAP1 inhibitors were topically administered to the left and right eyes, respectively, of OIR mice at P12 once per day for 5 days. At P17, mice were sacrificed and analyzed by whole‐mount staining with an anti‐CD31 antibody and confocal microscopy. Scale bar, 500 µm. D) Quantification of avascular areas and neovascular tuft. Retinal images collected as in (C) were quantitatively analyzed (n = 5 mice/group). Data information: Data are expressed as mean ± SEM. Student t‐test, *** P < 0.001; * P <0.5.
