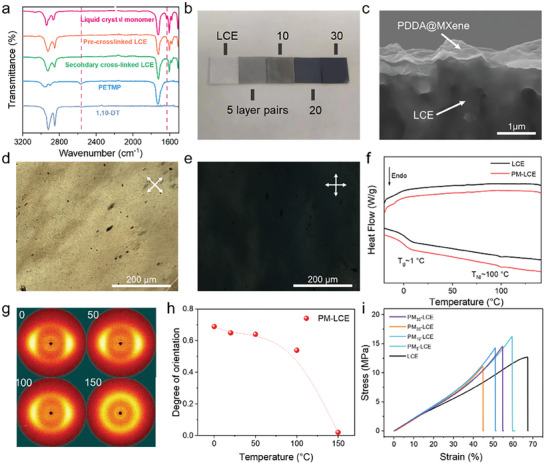
Figure 2.

a) FTIR spectra of raw materials and different crosslinking states of LCE. b) Photographs of LCE and PM‐LCE with different thicknesses of PM layers. c) Cross‐sectional SEM images of liquid nitrogen embrittlement of PM20‐LCE. POM image of LCE membrane d) before and e) after 45° rotation. f) DSC profiles of LCE and PM‐LCE. g) 2D‐WAXD patterns of PM‐LCE. h) Correlation of orientation and temperature of LCE and PM‐LCE. i) Stress–strain curves of samples perpendicular to the orientation of the LCE and the PM‐LCE.
