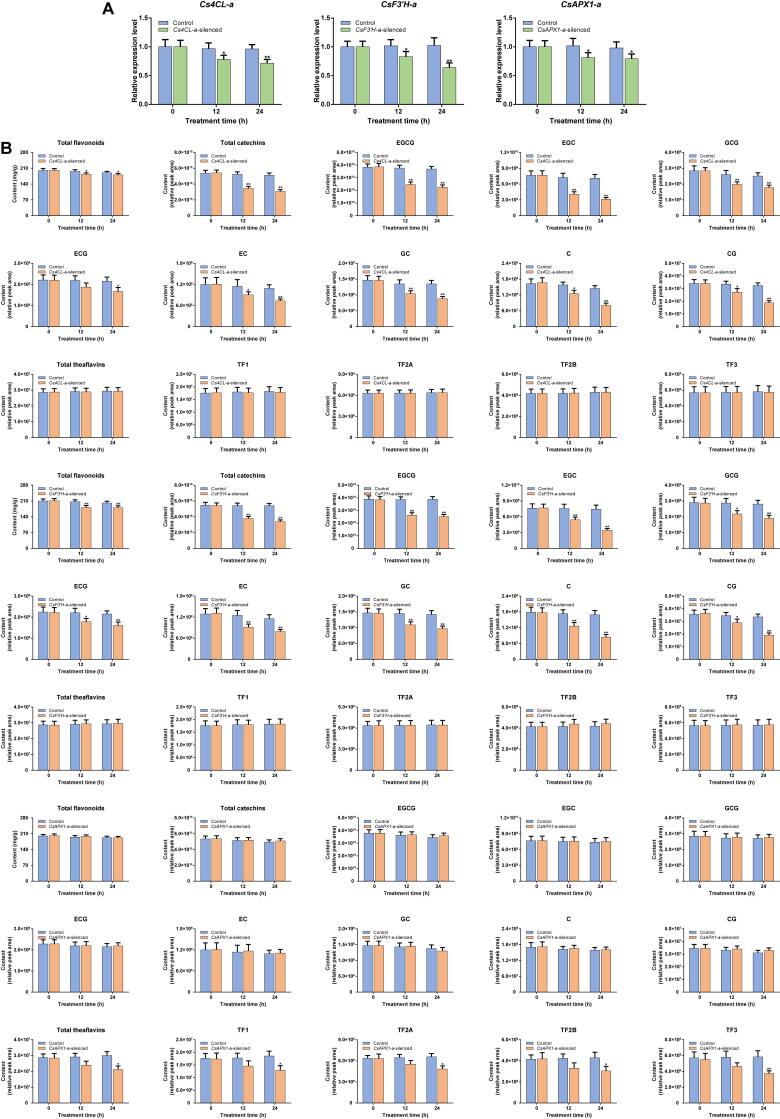
Supplementary Figure S13.
Relative expression levels of Cs4CL-a, CsF3'H-a, and CsAPX1-a, as well as the contents of flavor metabolites in AS transcript-silenced leaves A. Relative expression levels of Cs4CL-a, CsF3'H-a, and CsAPX1-a in AS transcript-silenced leaves determined by qRT-PCR. B. The contents of flavor metabolites in AS transcript-silenced leaves were determined by LC-MS. Data are presented as mean ± standard deviation. The differences among various groups were assessed by conducting a one-way analysis of variance and Tukey’s post hoc test. *, P < 0.05; **, P < 0.01; C, catechin; CG, catechin gallate; EC, epicatechin; ECG, epicatechin gallate; EGC, epigallocatechin; EGCG, epigallocatechin gallate; GC, gallocatechin; GCG, gallocatechin gallate; TF1, theaflavin; TF2A, theaflavin-3-gallate; TF2B, theaflavin-3′-gallate; TF3, theaflavin-3,3′-digallate.

