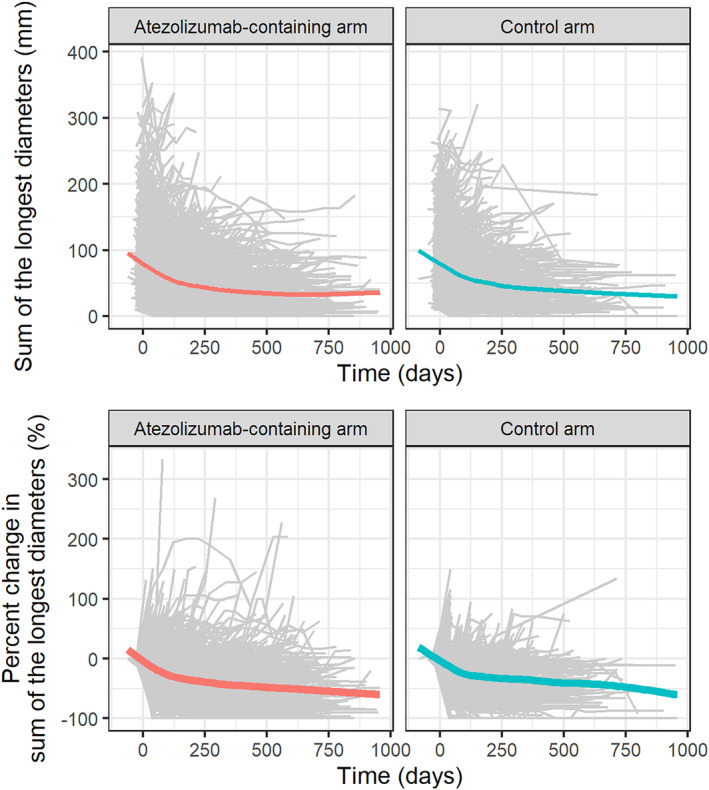
FIGURE 1.

Tumor size profiles over time in atezolizumab‐containing arms and control arms. Absolute sum of the longest diameters (top) and percent change in sum of the longest diameters (bottom). Gray lines are the individual profiles of the sum of longest diameters. Colored lines are the local polynomial regression smooth curves across individual data.
