
FIGURE 2.
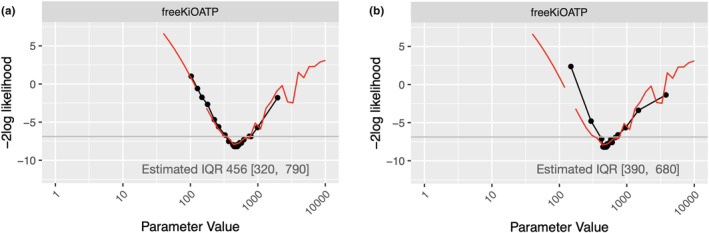
Comparison of the profile likelihood of inhibition constant (freeKiOATP) of the PBPK model for DDI of pitavastatin and rifampicin 11 (Example 1) drawn using the proposed method and the conventional method. The black line is the approximate profile likelihood drawn using the proposed method. Red is the profile likelihood using the conventional method. (a) Approximate profile likelihood drawn with an additional CGNM iterations which took 3.7 min. (b) Approximate profile likelihood drawn without any extra model evaluation (hence it took around 1.1 s). CGNM, Cluster Gauss‐Newton method; DDI, drug‐drug interaction; IQR, interquartile range; PBPK, physiologically‐based pharmacokinetic.