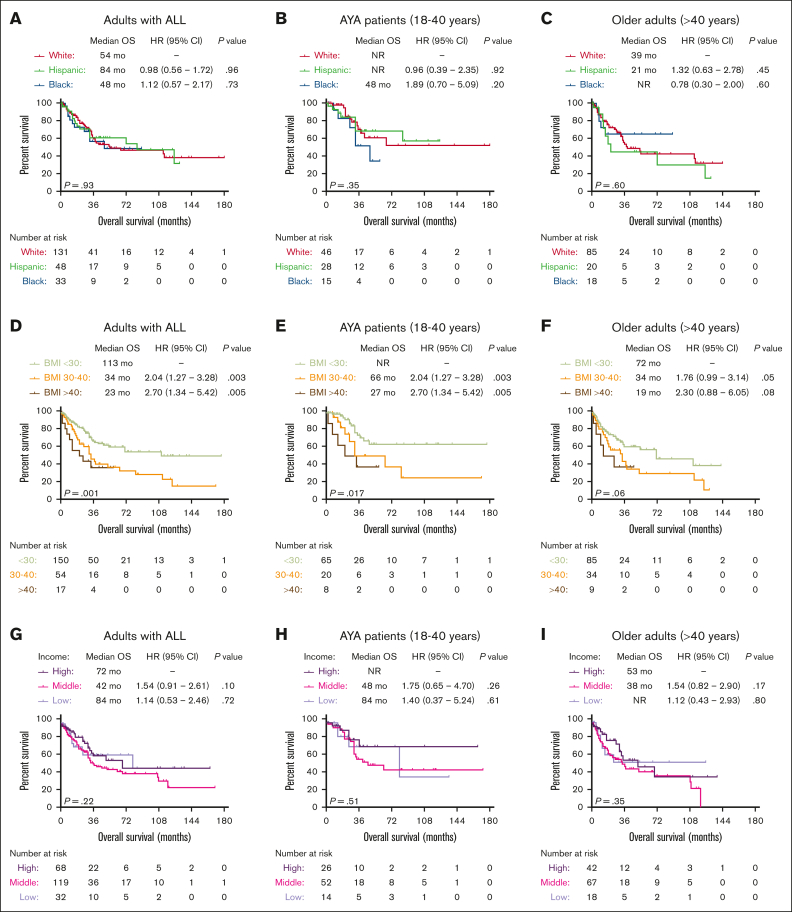
Figure 2.
Socioeconomic predictors of survival in patients with ALL treated at the University of Chicago. Kaplan-Meier OS curves for adult patients with ALL, stratified based on race (A), race and age groups (B-C), BMI at diagnosis (D), BMI and age groups (E-F), median income (G), median income, and age groups (H-I).

