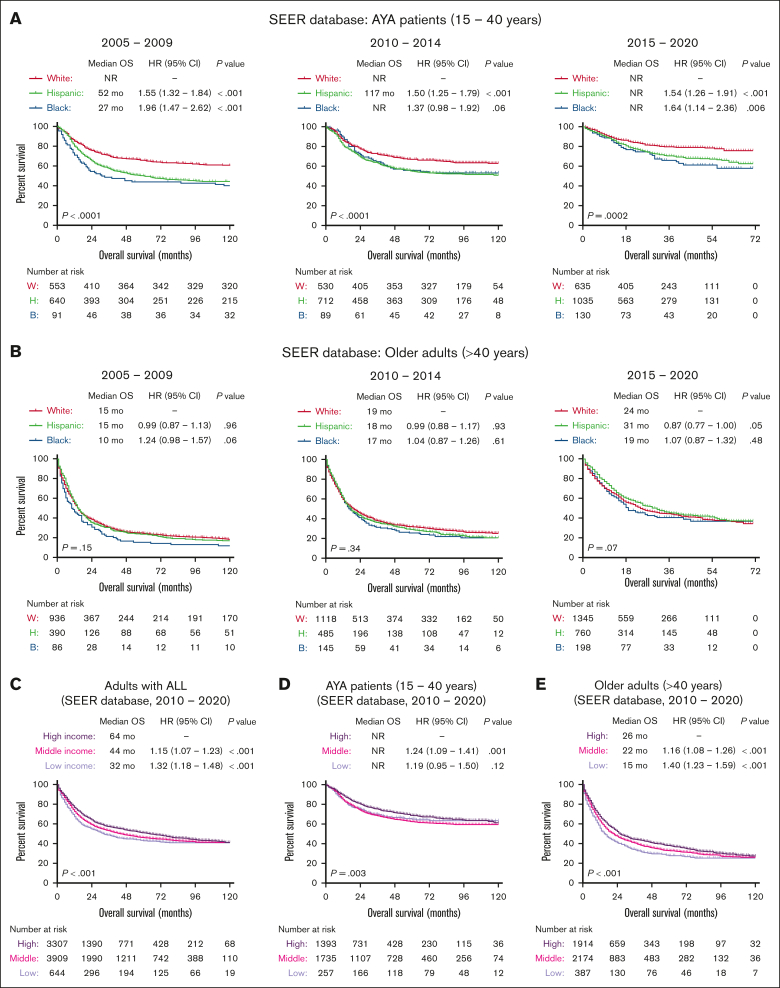
Figure 3.
Socioeconomic predictors of survival in patients with ALL registered in the SEER database. Kaplan-Meier OS curves for adult patients with ALL, stratified based on race and year of diagnosis in AYA patients (A), older adults (B), and further stratified based on median income (C) and age groups (D-E) for patients treated between 2010 and 2020.

