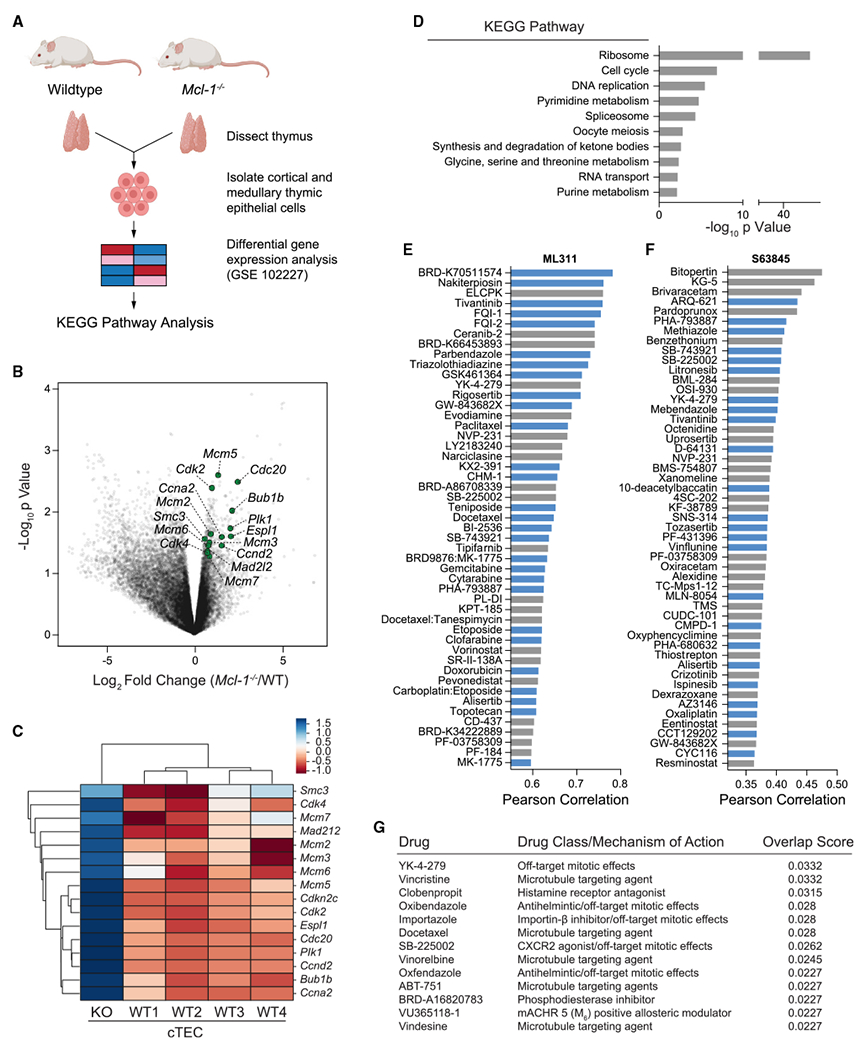
Figure 2. Correlation between MCL-1 and cell-cycle perturbations across transcriptomic and pharmacologic datasets.

(A) Gene expression analysis workflow for comparative analysis of wild-type and Mcl-1 conditionally deleted thymic epithelial cells (GEO dataset GSE102227).
(B) Differential gene expression analysis of wild-type and Mcl-1−/− murine cortical thymic epithelial cells, as quantified by log2 fold changes (x axis) and significance (y axis). DNA replication and cell-cycle-related genes with the most differential upregulation upon conditional Mcl-1 deletion are highlighted in green.
(C) Clustermap showing the comparative gene expression of select DNA replication and cell-cycle genes in wild-type (WT1-4) vs. Mcl-1−/− (KO) cortical thymic epithelial cells (cTECs).
(D) Kyoto Encyclopedia of Genes and Genomes analysis revealed ribosome biogenesis, cell cycle, and DNA replication as the most significantly enriched transcriptomic pathways upon Mcl-1 deletion in murine thymic epithelial cells.
(E and F) Selective small-molecule inhibition of MCL-1 by ML311 (E) or S63845 (F) correlates with the pharmacologic profiles of anti-proliferative drugs based on an analysis of sensitivity data of ~500 drugs across the Cancer Cell Line Encyclopedia (CTRP v2.0, Broad Institute). Compounds with established anti-proliferative and anti-mitotic effects are colored in blue.
(G) The gene expression signature of conditional Mcl-1 deletion in murine thymic epithelial cells (GEO dataset GSE102227) correlates with that of pharmacologic treatment with microtubule-targeting and anti-mitotic agents (L1000CDS2 database).
See also Figure S3.
