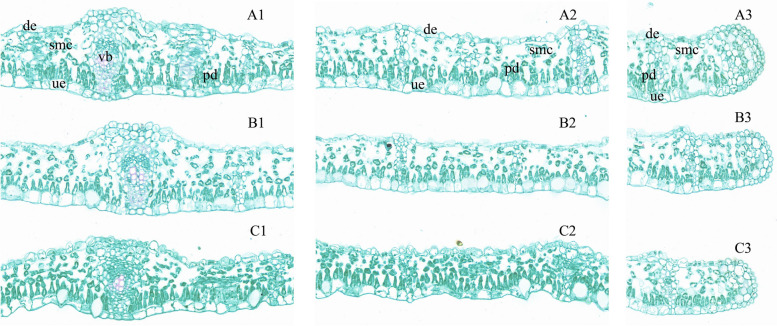
Fig. 2.
Anatomical changes of the leaflets of Dalbergia odorifera exposed to waterlogging and salinity with the control (A1-A3), WL (B1-B3) and ST (C1-C3) treatment. Row 1 (A1, B1 and C1) represents the vein of a leaflet, row 2 (A2, B2 and C2) the cross-section of a leaflet and row 3 (A3, B3 and C3) the edge of a leaflet. All images were taken at a set of 20 × zoom level with CaseViewer and scale bars = 50 μm. The letters within the images are: de, down-epidermis; pd, palisade mesophyll cell; smc, spongy mesophyll cell; ue, upper-epidermis; vb, vascular bundle

