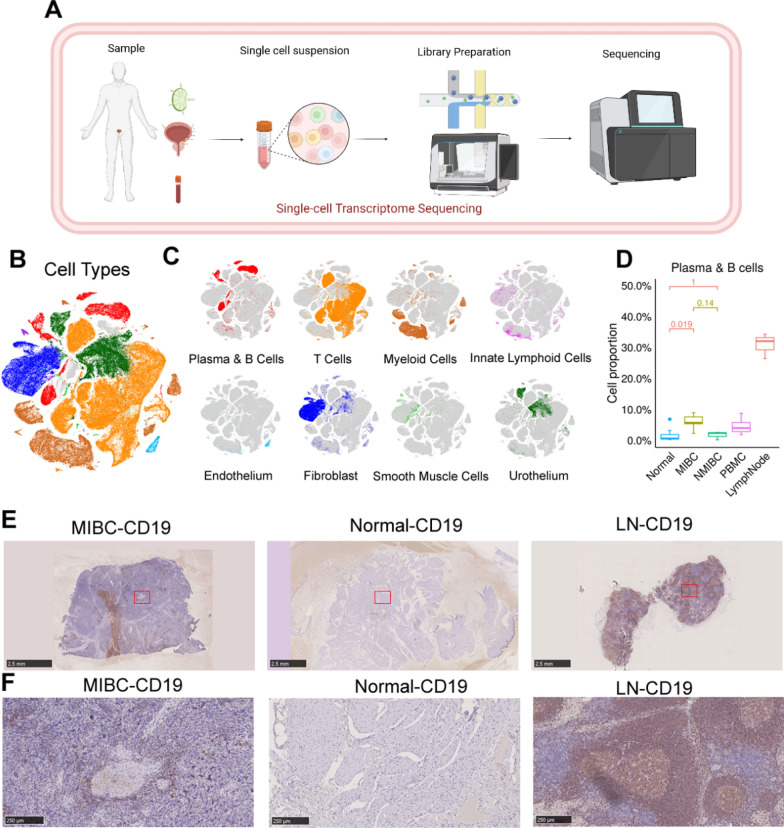
Fig. 1.
Single-cell transcriptional profiles of bladder cancer tissues and adjacent lymph nodes. A Schematic of the workflow. B The t-distributed stochastic neighbor embedding (tSNE) plot displays the cellular profiles of individual cells, which have been characterized by their dominant cell types. C tSNE plot of single cells profiled by dominant cell types (B cells). D Box plot showing the proportion of B cells and plasma cells from MIBC, NMIBC, normal tissue, PBMC, and lymph node samples. MIBC, n = 7; NMIBC, n = 3; Normal, n = 9; PBMC, n = 4; lymph nodes, n = 3. E, F Immunohistochemical staining of CD19 showing B-cell infiltration in tumor (left), normal tissue, and lymph node (right) samples. Scale bar: 2.5 mm in panoramic images and 250 μm in magnified images

