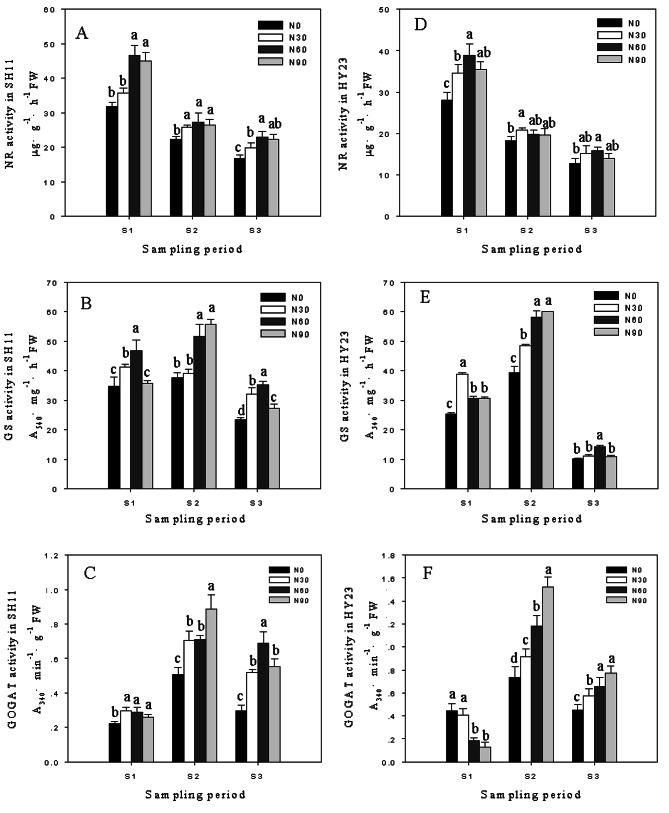
Fig. 3.
The pod enzymatic activities of NR, GS, GOGAT under different nitrogen applicationin pod zone in SH11(A, B, C) and HY23 (D, E, F). Values are shown as means ± SD of three independent biological sample. Different lowercase letters in the bar graph indicate significantly different between different nitrogen application ratesin the same cultivar at P < 0.05 according to Duncan’s multiple range test. N0, N30, N60, N90 meaning that nitrogen application ratesin pod zone were 0, 30, 60 and 90 kg·hm− 2 respectively. S1, S2, S3 represent 10, 20, 30 days after peanut gynophores penetration soil

