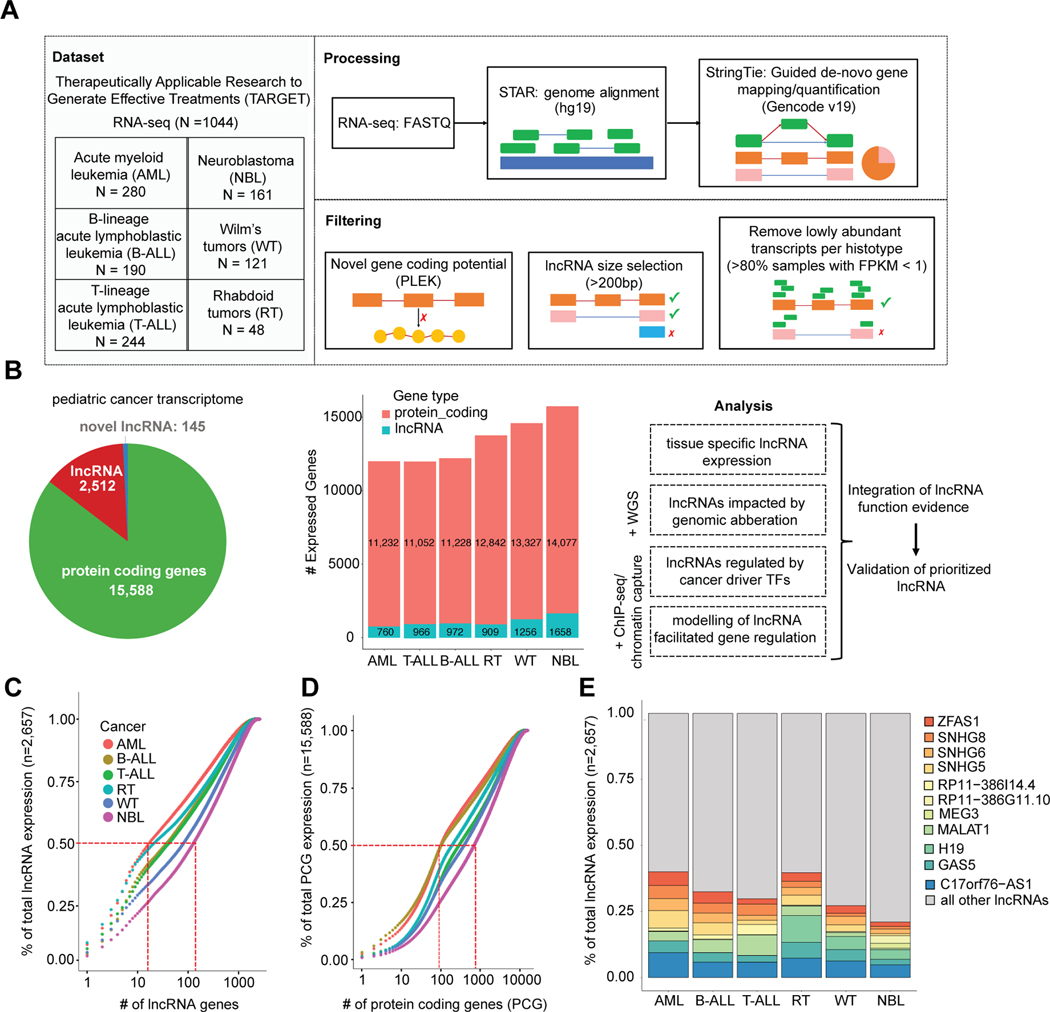
Figure 1: Pan-pediatric cancer transcriptome characterization.
(A) Overview of pan-pediatric cancer RNA-seq dataset and schematic of data processing and filtering. Reads from RNA-seq fastq files were aligned using the STAR algorithm and then gene transcripts were mapped in a guided de novo manner and quantified via the StringTie algorithm. Genes were considered novel if they did not have transcript exon structures matching genes in the GENCODE v19 or RefSeq v74 databases. Novel genes were assigned as lncRNAs based on length >200bp and non-coding potential calculated using the PLEK algorithm. Transcripts with low expression (FPKM <1 in >80% samples) were not considered for further analysis. (B) Pie graph showing the quantity of robustly expressed protein coding genes, GENCODE/RefSeq annotated lncRNAs, and novel lncRNAs. The number of genes expressed per cancer is also shown. Adjoining schematic gives overview of additional data types that were integrated with transcriptome data: WGS, ChIP-seq, and chromatin capture. Listed are the analyses used to elucidate lncRNAs with functional roles in pediatric cancer. (C) Cumulative expression plots comparing the number of lncRNAs and (D) protein coding genes, respectively, that constitute the total sum of gene expression (FPKM) per pediatric cancer. (E) Percentage of total lncRNA expression (FPKM) accounted for by the union of top five expressed lncRNAs per cancer (total 11 lncRNAs).

