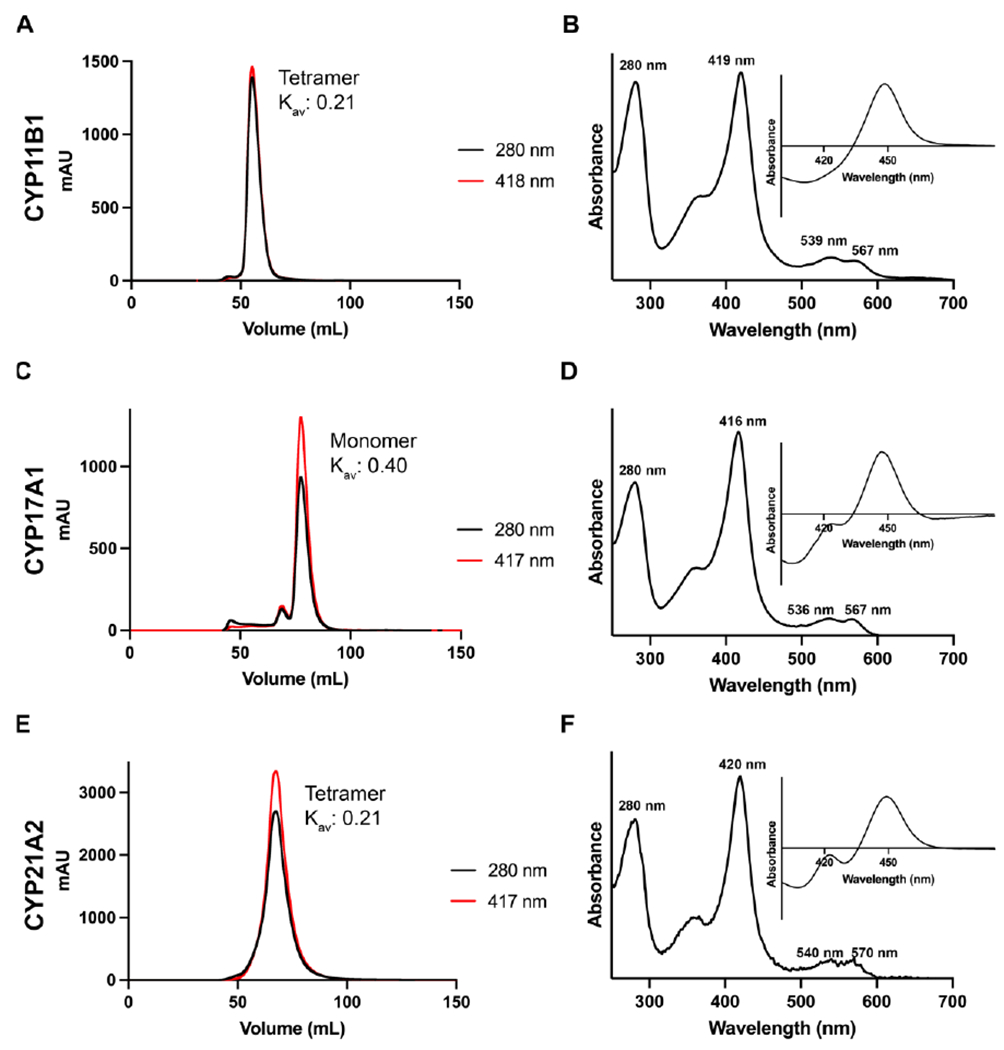
Figure 4. Representative chromatograms and spectra for steroidogenic P450 enzymes at the size exclusion chromatographic step.

Chromatograms (panels A, C, E) track the absorbance of the Soret peak (red), the absorbance of at 280 nm (black) during an isocratic run. While the specific elution volumes vary between columns, the Kav should be relatively consistent between different columns calibrated with different standards. The absolute spectra (panels B, D, and F) show the Soret peak wavelength and relative height compared to the 280 nm peak, while the reduced carbon monoxide difference spectra (B, D, and F insets) show the relative amounts of P450 to P420 at this stage of the purification.
