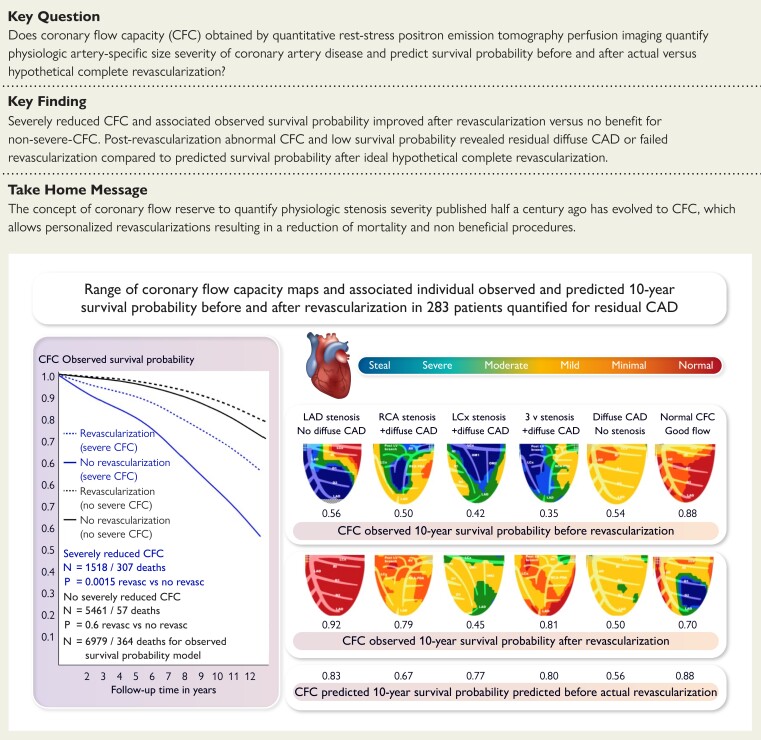
Structured Graphical Abstract.
Coronary flow capacity (CFC) and survival prediction after revascularization: physiological basis and clinical implications. CFC maps in one view before (upper row) and after revascularization (lower row) show residual diffuse coronary artery disease (CAD), stenosis, and incomplete or inappropriate revascularization as examples from 283 pre-post-revascularization positron emission tomography (PET) pairs. The 10-year survival probability is determined as a fraction of one for normal CFC (all red) by the proportional distribution of regional size-severity CFC abnormalities. The individual observed survival probabilities for each CFC map before and after actual coronary revascularization are listed below each CFC map. The virtual survival probability predicted for the baseline CFC map after virtual theoretical ideal complete revascularization is listed in the lowest (3rd) row for each case. The plots show the observed survival probability of 6979 PET cases with and without severely reduced CFC with and without non-randomized revascularization followed over 12 years as the database from which individual survival probability is determined by multi-variable CFC components by Cox regression modelling. LAD, left anterior descending coronary artery; LCx, left circumflex artery; RCA, right coronary artery.

