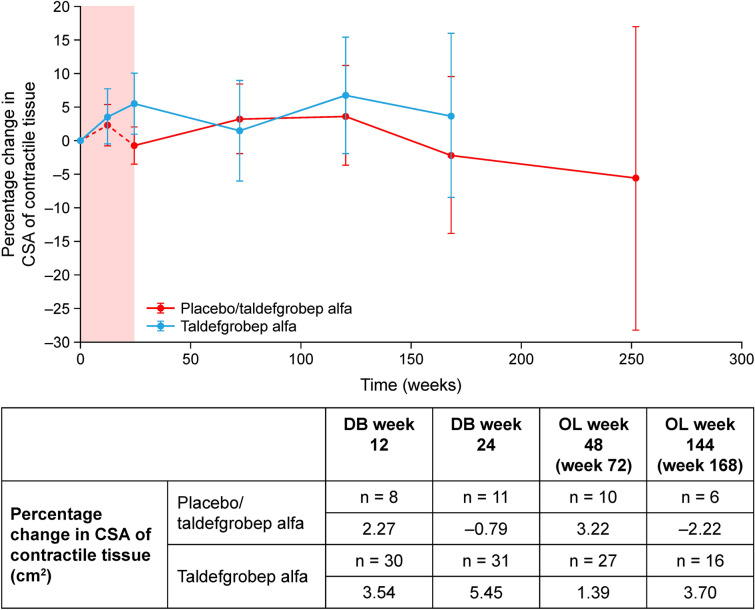
Fig. 10.
Percentage change from baseline in the CSA of contractile tissue of the right thigh in WN40226 (phase 1b/2 study). As a result of small sample sizes, and overlap between the dosing panels, taldefgrobep alfa-treated patients were pooled for analysis (blue line). Patients receiving placebo in the DB phase (red line) were also pooled across the dosing panels. At week 24, all placebo patients were switched to taldefgrobep alfa, receiving the dose assigned to their panel. Error bars represent 95% confidence interval of the mean. CSA cross-sectional area, DB double blind, OL open label

