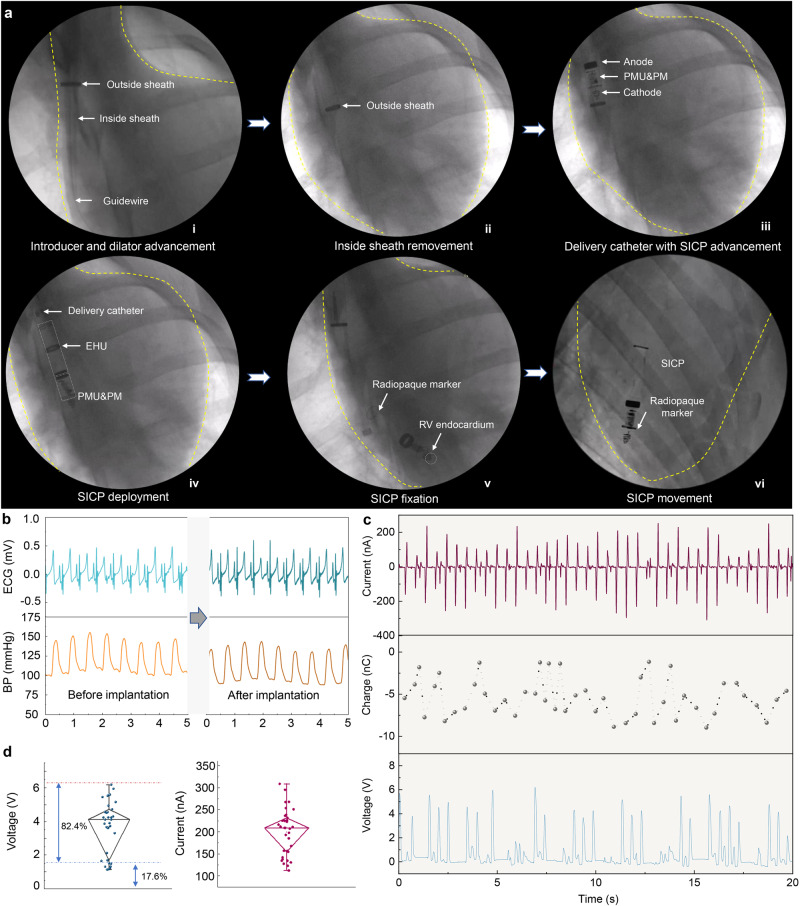
Fig. 4. Energy harvesting of SICP in vivo.
a Fluoroscopy images of minimally invasive delivery of SICP to the right ventricle via the venous system under fluoroscopic guidance. b ECG and blood pressure signals of the animal before and after SICP implantation. c Isc, Qsc, and Voc of SICP in vivo. d Statistical analysis of Voc and Isc (there are 34 data points for each test group. The box ends represent the 25th and 75th percentiles. The horizontal line in each box represents the median. The upper and lower whiskers refer to the range of non-outlier data values. Outliers were plotted as individual points). Source data are provided as a Source Data file.

