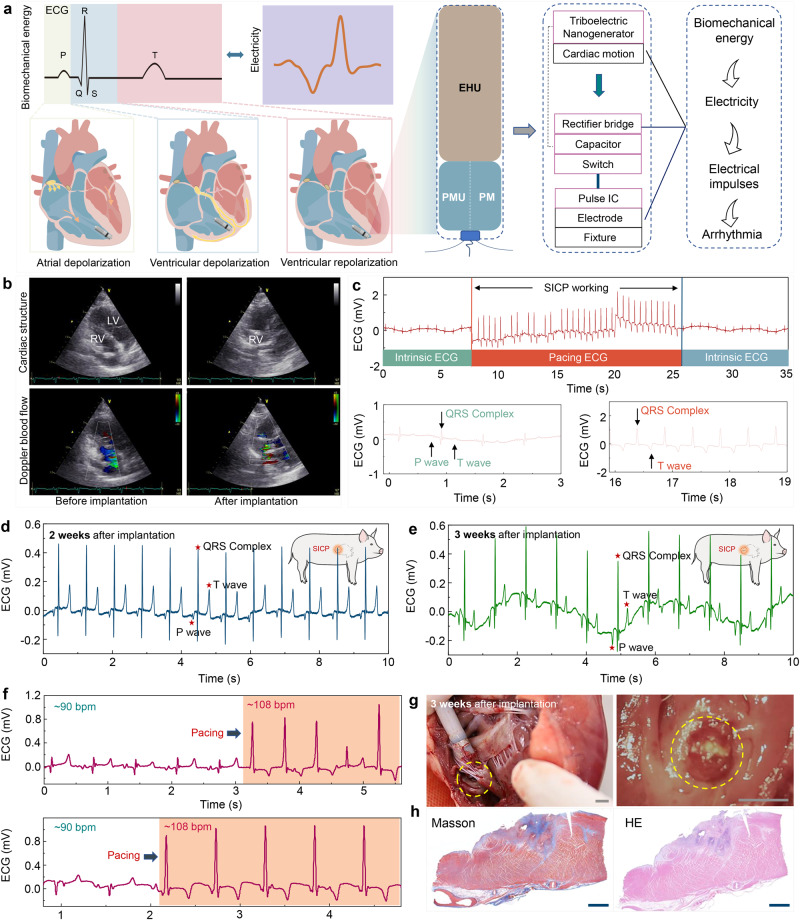
Fig. 5. Illustration pacing performance of SICP in vivo.
a Block diagram of the components of SICP. b Transthoracic echocardiograms of SICP before and after implantation. c Animal ECG signal when SICP works during minimally invasive implantation. d Animal ECG signal of 2 weeks and e 3 weeks after implantation. f Animal ECG signal when SICP works at 3 weeks. g Photographs of SICP fixed to the endocardium at 3 weeks (Scale bar = 0.5 cm). h Photographs of Masson’s trichrome and Hematoxylin−eosin (HE) staining for myocardial tissue at the fixation site (Scale bar = 200 μm). Source data are provided as a Source Data file.

