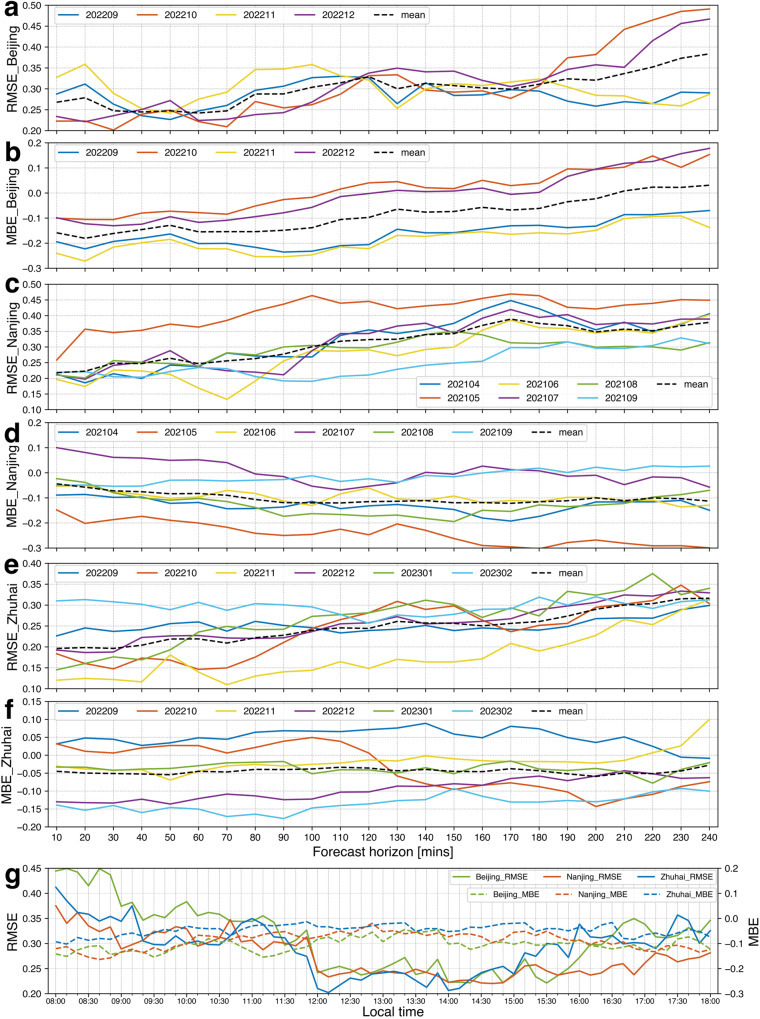
Fig. 2. RMSE and MBE between the predicted CF and the CF obtained by all-sky imagers.
Subfigures (a), (c), (e) and (b), (d), (f) are the RMSEs and MBEs for Beijing, Nanjing and Zhuhai all-sky imager stations, respectively. The different colored lines represent the results for different months, and the dashed black line represents the mean of all the lines. Subfigure (g) depicts the mean RMSE and MBE of three all-sky imager sites at different local time of one day. Source data are provided as a Source Data file.

