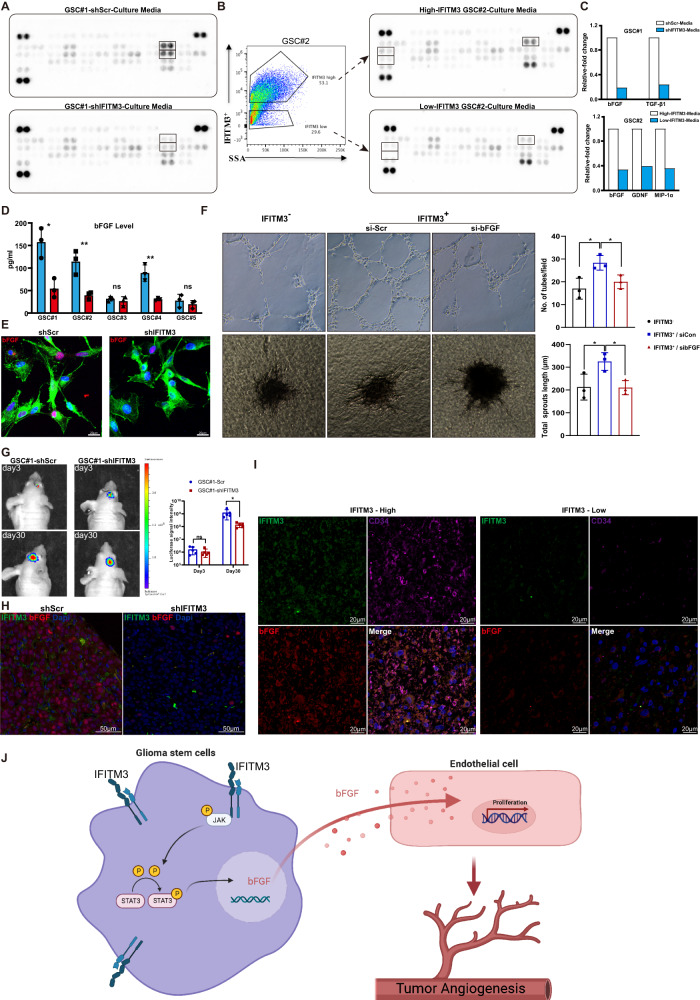
Fig. 5. IFITM3 regulates GSC-mediated angiogenesis process in a bFGF-dependent manner.
A GSC#1-shScr or GSC#1-shIFITM3 were cultivated for 24 h, of which culture media were harvested for cytokine detection using angiogenesis antibody array. B GSC#2 cells were fractionated into IFITM3+ or IFITM3-groups, and angiogenic cytokines were measured. C Bar charts show markedly altered cytokines of (A) and (B). D Secreted bFGF levels of GSC#1–5 were measured using Elisa assay. E Representative immunofluorescent images with bFGF (red) staining of GSC#1-shScr and GSC#1-shIFITM3. F-actin (green) is stained with phalloidin. Nuclei are counterstained with Dapi (blue). Scale bar = 50 μm. F Angiogenic abilities of fractionated IFITM3− and IFITM3+ GSCs are measured, with the latter cells treated with manipulated bFGF downregulation. G Intracranial xenograft models are constructed with GSC#1-shScr and GSC#1-shIFITM3. Tumor sizes are monitored by in vivo imaging. H Representative immunofluorescence images staining for IFITM3 (green) and bFGF (red) and in GSC#1-shScr or GSC#1-shIFITM3 xenografts. I Representative immunofluorescence images staining for IFITM3 (green), bFGF (red), and CD34 (purple) in human GBM samples. J Schematic illustration of GSCs-mediated glioma angiogenesis through IFITM3-JAK/STAT-bFGF signaling pathway. Results are represented as Mean ± SD of biologically triplicate assays. *p < 0.05, **p < 0.01, ***p < 0.001. ns not significant.

