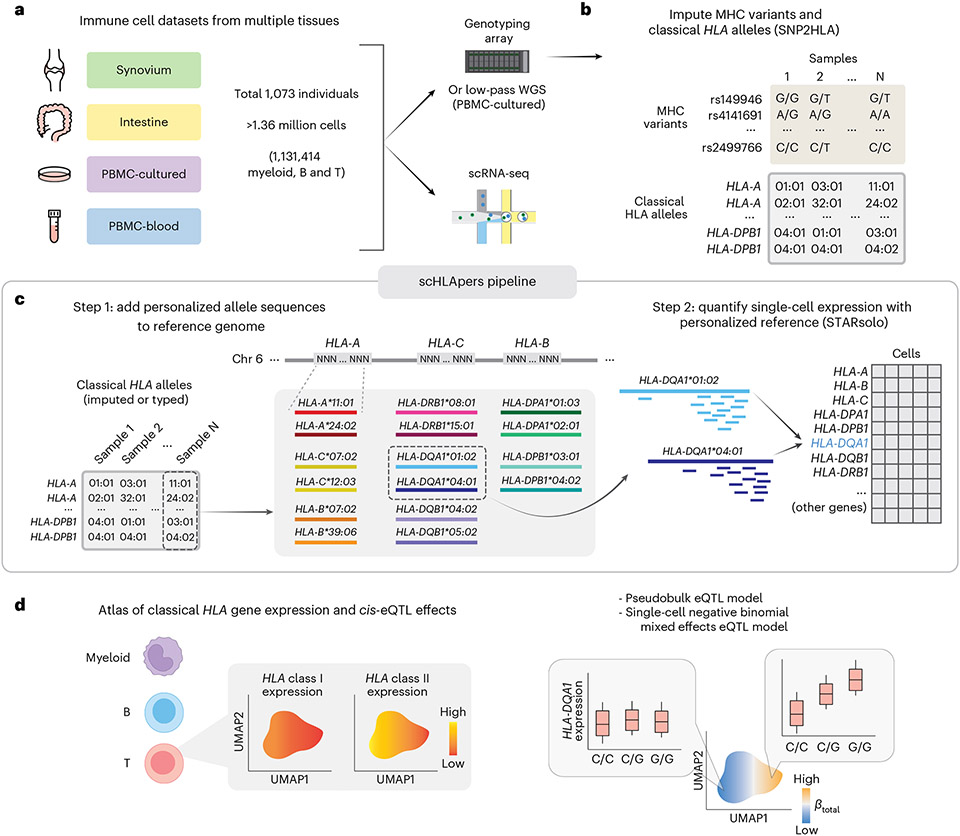
Fig. 1 ∣. Overview of study and scHLApers pipeline.
a, We used four datasets with genotype and scRNA-seq data: synovium (n = 69 individuals, m = 275,323 cells), intestine (n = 22, m = 137,321), PBMC-cultured (n = 73, m = 188,507), and PBMC-blood (n = 909, m = 765,079). b, Using the genotype data, we imputed SNPs within the MHC and one- and two-field classical HLA alleles. c, Schematic of scHLApers pipeline, where scRNA-seq reads are aligned to a personalized reference for each individual based on classical HLA alleles. In the example, an individual is heterozygous for all eight HLA genes, so 16 additional contigs are added to the reference. Original reference gene sequences are masked with Ns. scHLApers outputs a whole-transcriptome counts matrix with improved HLA gene estimates. Both alleles contribute to count estimation for each gene. d, We generated an atlas of HLA expression across all cell types (left) and mapped eQTLs for HLA genes in myeloid, B and T cells. Schematic of example dynamic eQTL (right), where eQTL strength (slope, ) changes across T cell states.

