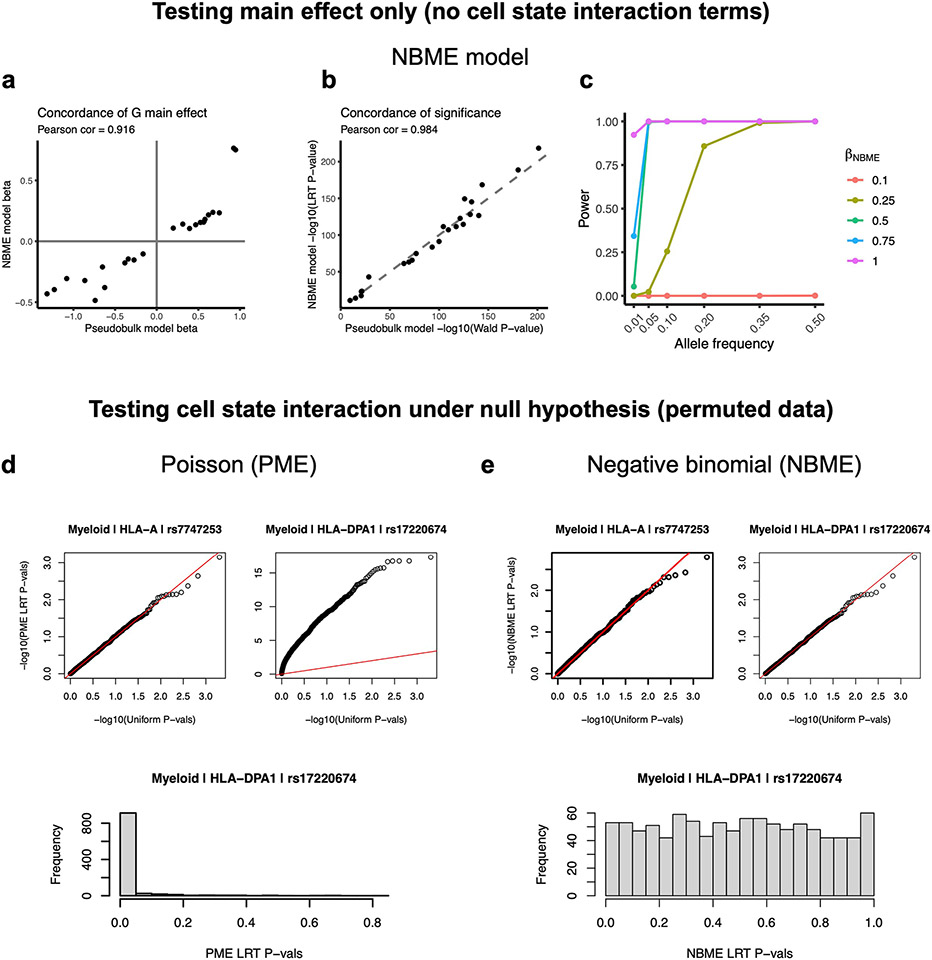
Extended Data Fig. 4 ∣. Testing single-cell NBME model for concordance with pseudobulk and for calibration for genotype-cell-state interactions.
a-e, The models in a-c test genotype main effects, whereas d and e test genotype-cell-state interaction. a,b, Concordance of genotype main effect estimates (a) and significance of genotype main effect (b) between the NBME model (y-axis) and the pseudobulk model for the PBMC-blood dataset (x-axis) across all cell types and classical HLA genes. c, Power of the NBME single-cell eQTL model to detect regulatory effects across allele frequencies. The proportion of simulations where the null hypothesis was appropriately rejected at α = 5 × 10⁻⁸ (y-axis) in the presence of a simulated eQTL effect across 1000 simulations. Simulations were run across a range of eQTL allele frequencies (x-axis) and effect sizes (colors) using the PBMC-blood myeloid data and HLA-DQA1 expression. d,e, We permuted cell state (10 hPCs as a block) for 1,000 tests and obtained interaction P-values from a one-sided likelihood ratio test (LRT) comparing to the null model without G×hPC interaction terms. Q-Q plots showing statistical calibration (compared to uniform P-values) for PME model (d) versus NBME model (e) when testing for cell state interactions for representative class I (HLA-A) and class II (HLA-DPA1) genes in myeloid cells in PBMC-blood. The red line is the identity line. The histograms below show distributions of LRT P-values for HLA-DPA1.

