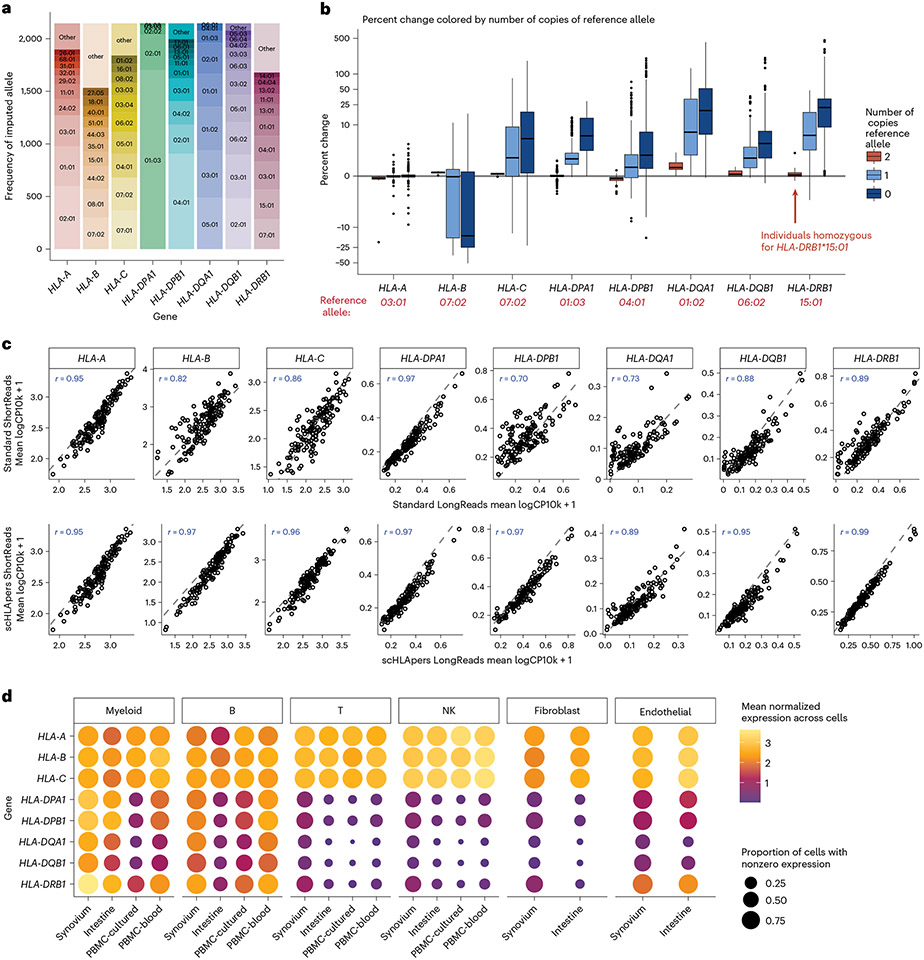
Fig. 2 ∣. Quantifying single-cell HLA expression using scHLApers.
a, Frequency of each imputed two-field HLA allele across all cohorts. Most common alleles (up to ten) labeled for each gene, with other alleles grouped into ‘other’. Alleles with frequency of less than five are not labeled. b, Boxplot (each observation is one sample) showing percentage change (y axis) in the estimated UMIs for each HLA gene (x axis) summed across all cells after quantification with scHLApers (compared to a pipeline using the standard reference genome) in the combined dataset (n = 1,073 individuals), colored by number of copies of the reference allele (labeled in red below for each gene). Gray horizontal line denotes no change. Boxplot center line represents median, lower/upper box limits represent 25/75% quantiles, whiskers extend to box limit ± 1.5× interquartile range, and outlying points are plotted individually. c, Comparing the estimated HLA expression as measured using shorter reads (84 bp, y axis) versus longer reads (289 bp, x axis) in the standard pipeline (top row) compared to scHLApers (bottom row). Each dot shows the mean log(CP10k + 1)-normalized expression across cells for one sample in PBMC-cultured (n = 146 samples from 73 individuals). r is Pearson correlation; dashed gray line is identity line. d, HLA expression in different cell types across cohorts: myeloid (m = 145,090 cells), B (m = 180,935), T (m = 805,389), NK (m = 125,865), fibroblasts (m = 82,651) and endothelial (m = 26,300). Dot size indicates proportion of cells with nonzero expression; color indicates log(CP10k + 1)-normalized expression (mean across cells).

