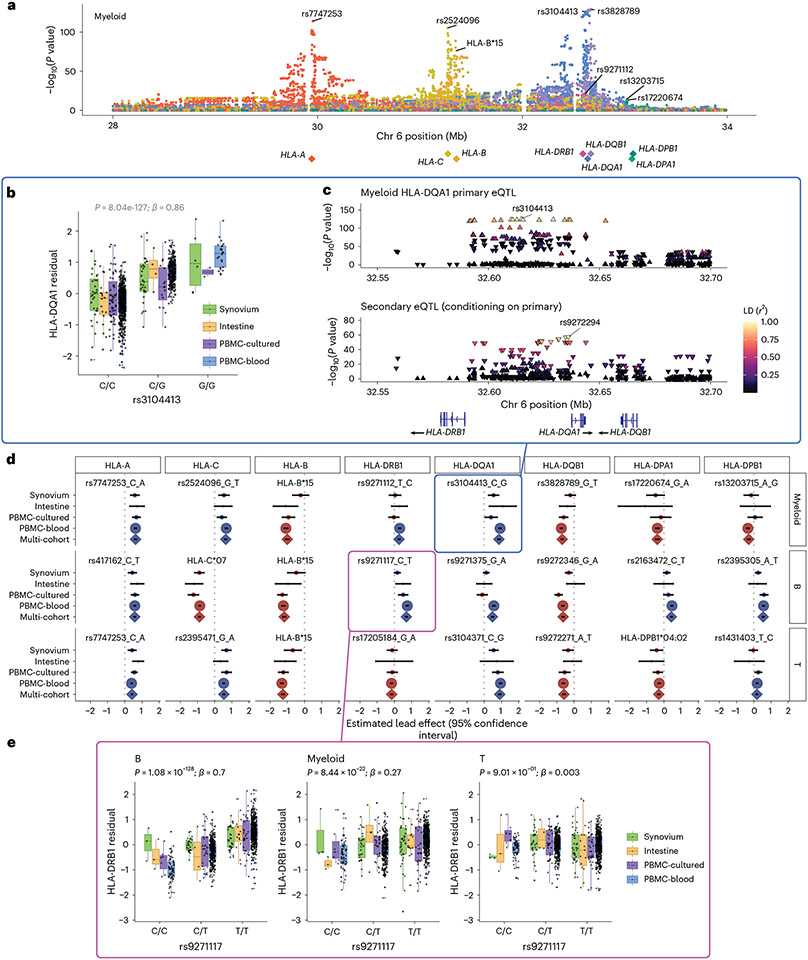
Fig. 3 ∣. eQTLs for classical HLA genes from pseudobulk analysis.
a, Manhattan plot showing the significance (y axis) of association between tested MHC variants (x axis) and expression of each HLA gene (color) in myeloid cells from the multi-cohort model. Most significant (lead) eQTLs are labeled. Diamonds indicate TSS of each gene. b, Boxplot showing an example lead eQTL (rs3104413). Increased dosage of the G allele (x axis) associates with higher HLA-DQA1 expression in myeloid cells (y axis: units are the residual of inverse normal transformed mean log(CP10k + 1)-normalized expression across cells after regressing out covariates), n = 1,025 individuals total (synovium n = 69, intestine n = 22, PBMC-cultured n = 73, PBMC-blood n = 861), plotted by dataset (color). All lead eQTLs shown in Supplementary Fig. 6c, Locus zoom plot for the primary (rs3104413) and secondary (rs9272294) eQTLs for HLA-DQA1 in myeloid cells. Significance of association (y axis) is shown for nearby variants on chromosome 6 (x axis); color denotes LD (r2 with lead eQTL in multi-ancestry HLA reference). Triangles point upwards for a positive (downwards for negative) effect on expression. Gene bodies and direction of transcription (arrows) for HLA-DRB1, HLA-DQA1 and HLA-DQB1 are underneath. d, Grid showing lead eQTLs for each HLA gene (columns) in each cell type (rows: myeloid cells n = 1,025, B cells n = 1,069, and T cells n = 1,072 individuals total; for dataset breakdown, see Supplementary Table 2). Each element of the grid includes a forest plot with the estimated lead effect size (x axis) and 95% confidence interval (mean ± 1.96 standard error) of the estimate from the multi-cohort analysis (diamond) and the same variant-gene pair tested for an association within each cohort separately (dots above). Size of the dots/diamond indicates cohort size; color indicates sign of the ALT allele’s effect on expression (blue for positive, red for negative). The eQTLs boxed in blue and magenta are highlighted in b and c and in e, respectively. e, Example of a cell-type-dependent eQTL (rs9271117) that was the lead eQTL for HLA-DRB1 and strongest in B cells. Boxplots are formatted analogously to b and show the eQTL’s effect for all three cell types separately. In a–c and e, nominal Wald P values are derived from linear regression (two-sided test).

