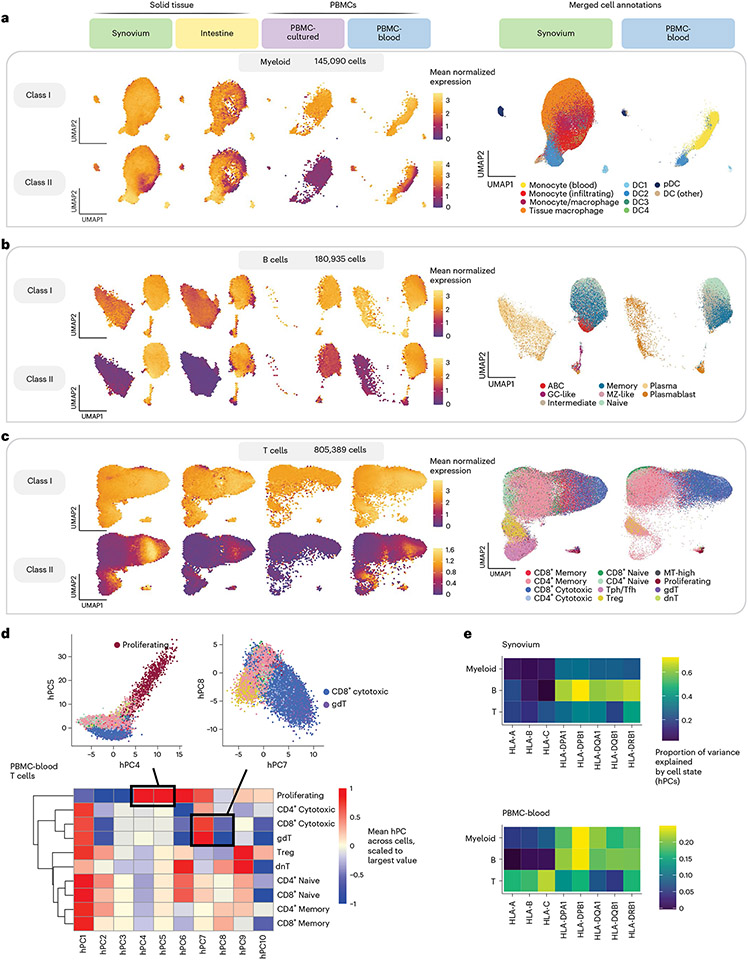
Fig. 4 ∣. Integrating single cells into a unified cell state embedding across datasets.
a–c, UMAP of cells generated using tissue-defined embedding (top ten hPCs from synovium and intestine), with PBMC datasets projected into the same space. The plot is divided into three sections: myeloid cells (a), B cells (b) and T cells (c). Left: class I and II HLA expression across cells across datasets. Cells are binned into hexagons to avoid overplotting (50 bins per horizontal and vertical UMAP directions) and colored by mean log(CP10k + 1)-normalized expression of class I/II genes per bin (for example, for class I, mean of HLA-A, HLA-B and HLA-C). Right: cell state annotations (color) for a representative PBMC (PBMC-blood) and solid tissue (synovium) dataset from merging annotations from each dataset to a shared set of labels. d, Heatmap showing mean value for each hPC (color) across cells for each discrete cell annotation within T cells in PBMC-blood. Values are scaled relative to the most extreme value across cell states. Black boxes and inset figures above show examples of how hPCs are linked to original cell state labels: proliferating cells (high in hPC4 and hPC5) and CD8+ cytotoxic and γδ (gdT) cells (high in hPC7, low in hPC8). e, Estimated proportion of variance in UMIs explained by cell state hPCs (color) across HLA genes and cell types.

