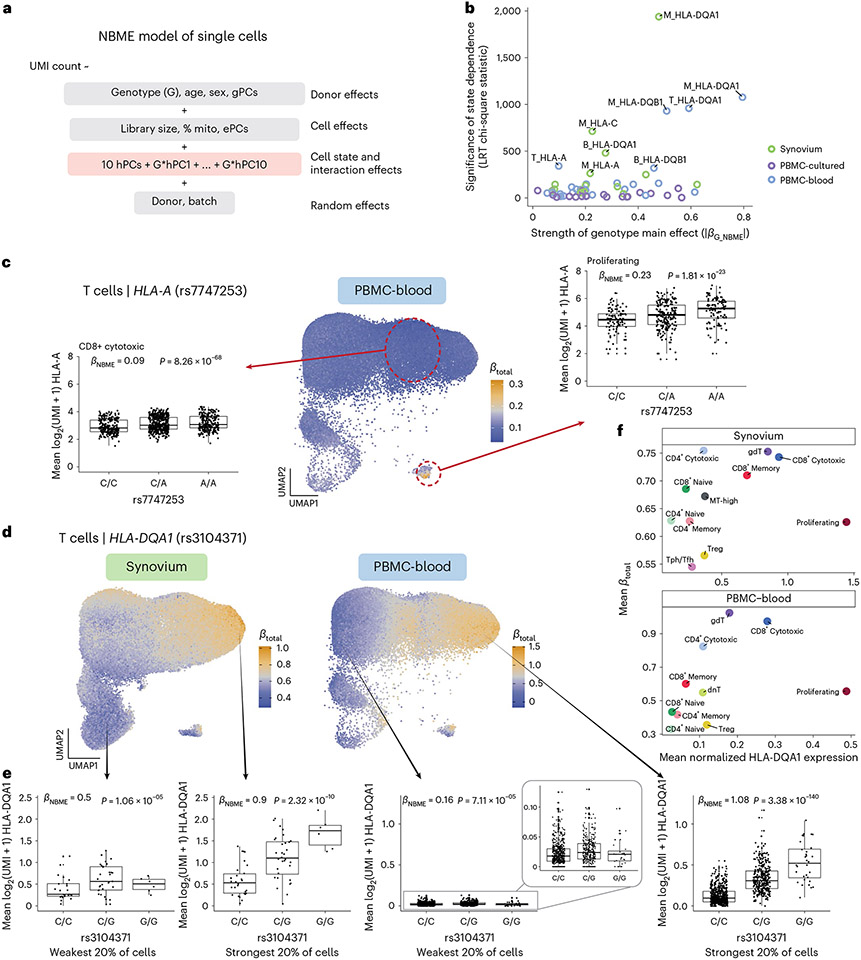
Fig. 5 ∣. Identifying dynamic eQTLs by modeling single cells.
a, NBME model of single cells used to identify cell-state-dependent regulatory effects. Pink box highlights terms for cell state (ten hPCs per cell type) and their interaction with genotype. b, Testing lead eQTLs identified in multi-cohort pseudobulk analysis for cell-state dependence using the NBME model in each dataset (color) in myeloid (‘M’), B and T cells. Magnitude of genotype main effect (x axis) versus the significance of cell-state interaction (y axis), measured using chi-square (χ2) statistic from LRT comparing full model (a) to null model without G × hPC interactions. c, Dynamic HLA-A eQTL (rs7747253) in T cells (n = 909 individuals, m = 538,579 cells in PBMC-blood). UMAP shows T cells colored by estimated eQTL strength . Boxplots for the eQTL effect are shown for two annotated cell states (CD8+ cytotoxic and proliferating, outlined in red circles), showing mean log2(UMI + 1) of HLA-A across all cells in the cell state per individual by genotype. and P values are derived from fitting the NBME model without cell-state interaction terms on the discrete cell populations and comparing to a null model without genotype using an LRT (n = 908 individuals, m = 96,516 cells for CD8+ cytotoxic; n = 409, m = 739 for proliferating). Boxplot center line represents median, lower/upper box limits represent 25/75% quantiles, whiskers extend to box limit ± 1.5× interquartile range, and outlying points are plotted individually. d–f, Dynamic HLA-DQA1 eQTL (rs3104371) in T cells (n = 68 individuals, m = 82,423 cells in synovium; n = 909, m = 538,579 in PBMC-blood). UMAP (d) colored by eQTL strength , from blue (weakest) to orange (strongest). Boxplots (e) showing the eQTL effects in cells from the top and bottom quintile of , showing mean log2(UMI + 1) per individual (y axis) by genotype. Labeled and P value are derived from fitting the NBME model without cell-state interaction terms on the cells from the discrete quintile and comparing to a null model without genotype using an LRT. Boxplot elements defined as in c. Scatterplot (f) showing the mean (y axis) compared to the mean log(CP10k + 1)-normalized expression of HLA-DQA1 (x axis) across annotated cell states (color). LRT, likelihood ratio test (one-sided).

