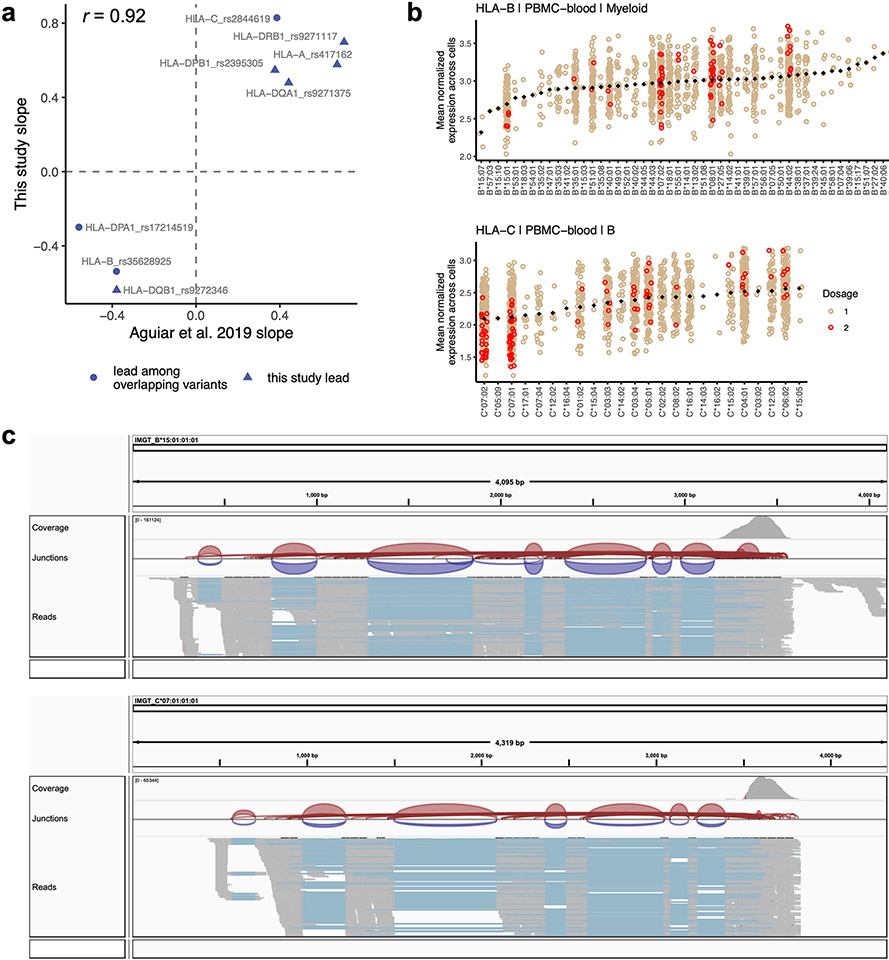
Extended Data Fig. 2 ∣. Concordance of eQTLs with bulk RNA-seq, differential allelic expression, and read alignment visualization.
a, Concordance between the effect sizes of lead HLA eQTLs identified in the multi-cohort pseudobulk model for B cells (this study, y-axis) and the same variant’s effect in LCLs identified through bulk RNA-seq eQTL analysis (Aguiar et al., x-axis). Because not all lead variants in this study were directly comparable due to different sets of tested variants, we tested the concordance of the most significant variant present in both datasets (triangles indicate that the exact lead variant in this study was also tested in Aguiar et al., whereas circles indicate ‘substitute’ lead variants was used for comparison). b, HLA-B expression in myeloid cells (top, n = 861 individuals) and HLA-C expression in B cells (bottom, n = 909), showing mean log(CP10k + 1)-normalized expression (y-axis) across cells for each individual in PBMC-blood by allele (x-axis). Each individual’s expression value is plotted once if they are homozygous (red) and twice if heterozygous (tan) for each allele (imputed dosage is rounded to the nearest integer). The black diamonds show the mean value for each allele (used to order the x-axis). c, Integrative Genomics Viewer (IGV) screenshots showing read alignments for alleles HLA-B*15:01 and HLA-C*07:01, associated with lower expression of the respective genes, for a representative individual in synovium.

