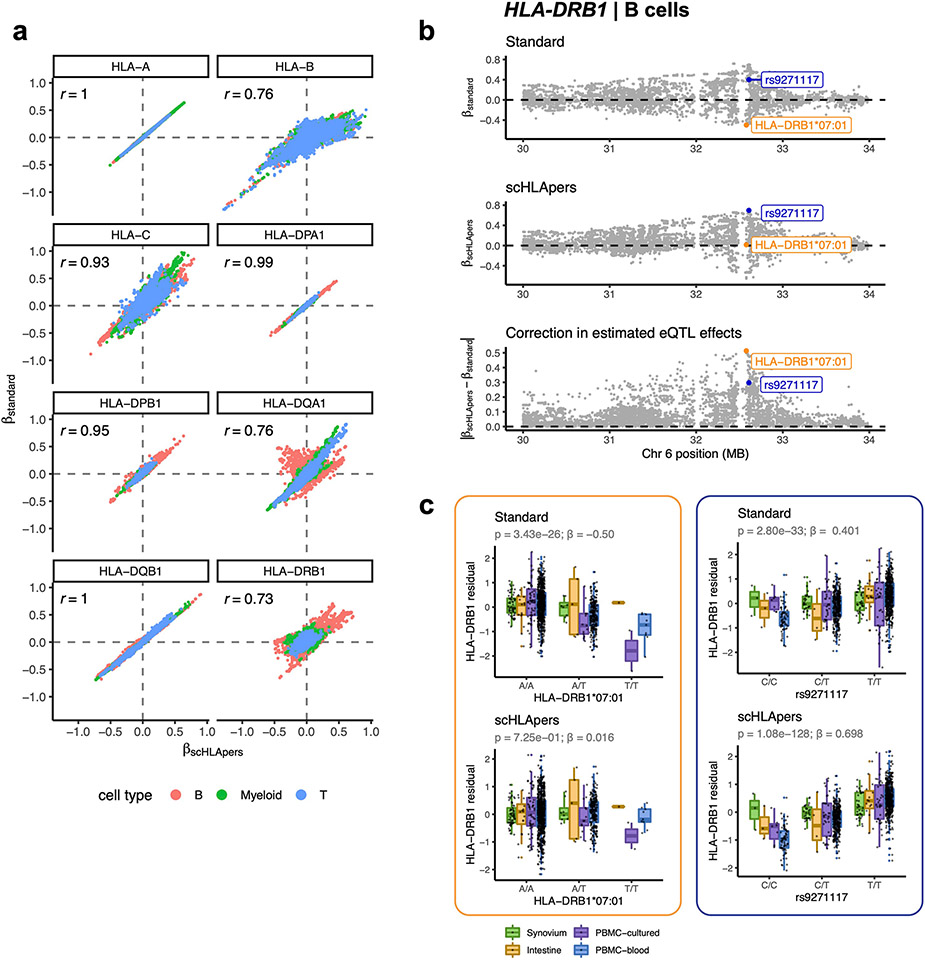
Extended Data Fig. 3 ∣. Personalization improves eQTL effect size estimates.
a, Comparison of eQTL effect size estimates calculated using expression quantified by scHLApers (x-axis) vs. standard pipeline (y-axis). Each dot represents one of 12,045 MHC-wide genetic variants tested using the pseudobulk eQTL model per cell type (color). Pearson correlation is labeled for each gene. b, Example of eQTL effect correction through the use of corrected expression estimates, shown for HLA-DRB1 in B cells. eQTL effect sizes (y-axis) estimated for MHC variants along Chr. 6 (x-axis), shown for standard pipeline (top), scHLApers pipeline (middle), and the magnitude of difference between the betas from the two pipelines (bottom). The variant with the largest correction in estimated eQTL effect (HLA-DRB1*07:01) is labeled in orange, and the lead variant in the scHLApers pipeline (rs9271117) is labeled in blue. c, Boxplots visualizing the eQTL effects across individuals for HLA-DRB1*07:01 (left) and rs9271117 (right) using HLA-DRB1 expression estimates from the standard (top) vs. scHLApers (bottom) pipelines. Increased dosage of the ALT allele (x-axis) vs. HLA-DRB1 expression in B cells (y-axis: units are residual of inverse normal transformed mean log(CP10k + 1)-normalized expression across cells after regressing out covariates), across n = 1,069 individuals total (synovium, n = 65; intestine, n = 22; PBMC-cultured, n = 73; PBMC-blood, n = 909), plotted by dataset (color). For HLA-DRB1*07:01, ‘A’ denotes absence of the allele, and ‘T’ denotes presence (rather than REF/ALT nucleotides). Nominal Wald P-values are derived from linear regression (two-sided test).

