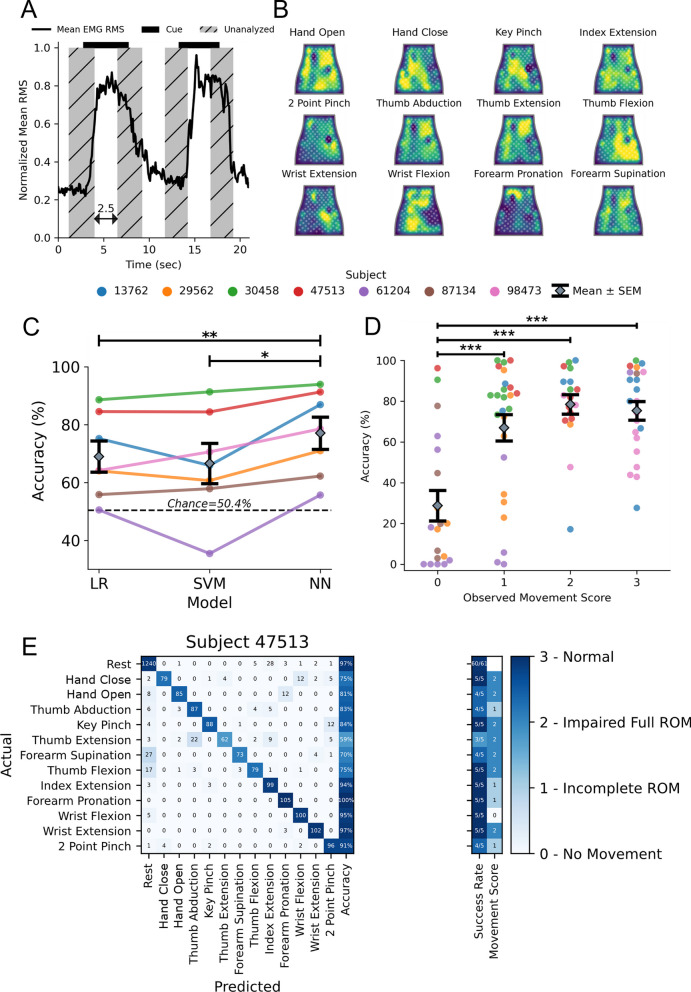
Fig. 3.
Decoding hand and wrist movements using the NeuroLife EMG System. A Illustration depicting the data used for training and testing the decoder. The presentation of the cue is shown as a black bar on the top of the plot, and the middle 2.5 s of the cue presentation is used for analysis. B Heatmaps of various movements from a subject with stroke. C Decoding performance comparing 3 models: LR (Logistic Regression), SVM (Support Vector Machine), and NN (Neural Network). The NN outperforms both the LR and SVM models (paired t-test NN vs. SVM, p = 9.3 × 10⁻³; NN vs. LR, p = 9.1 × 10⁻⁴). D Association between the observed movement score and decoder performance of the neural network (One-way ANOVA, Accuracy (%): F[3, 80] = 13.38, p = 3.7 × 10⁻⁷). The decoder struggles learning to predict movement attempts in which there was no observable movement (movement score = 0), and performs similarly when there is observable movement (movement score ≥ 1). E Confusion matrix for a subject with stroke detailing the decoding performance across all movements

